3:30 p.m. New York time
Half an hour before the closing bell. The S&P 500 futures moved 1.25 points, so far, above January 25’s high, to 4385.50, as noted in the 1:05 p.m. entry, requiring a change in the principal analysis At this point I’m sticking with the new principal analysis: The upward correction that began on February 24 is still underway and is in its first leg. Elliott terminology: Wave A{-8} within wave 4{-7} is still underway. Of this morning’s alternatives (see the What Does It Mean and What Are the Alternatives sections, below): Alternative #1 is the new principal analysis. The old principal analysis is now the new Alternative #1. And since the price has declined from today’s high, Alternative #2 is still in play.
2:25 p.m. New York time
OKE earnings play entry. I have entered a short bull put options spread on OKE and have posted an analysis of the trade.
2:10 p.m. New York time
KR earnings play entry. I’ve entered a short bull put options spread on KR and have posted an analysis of the trade.
1:05 p.m. New York time
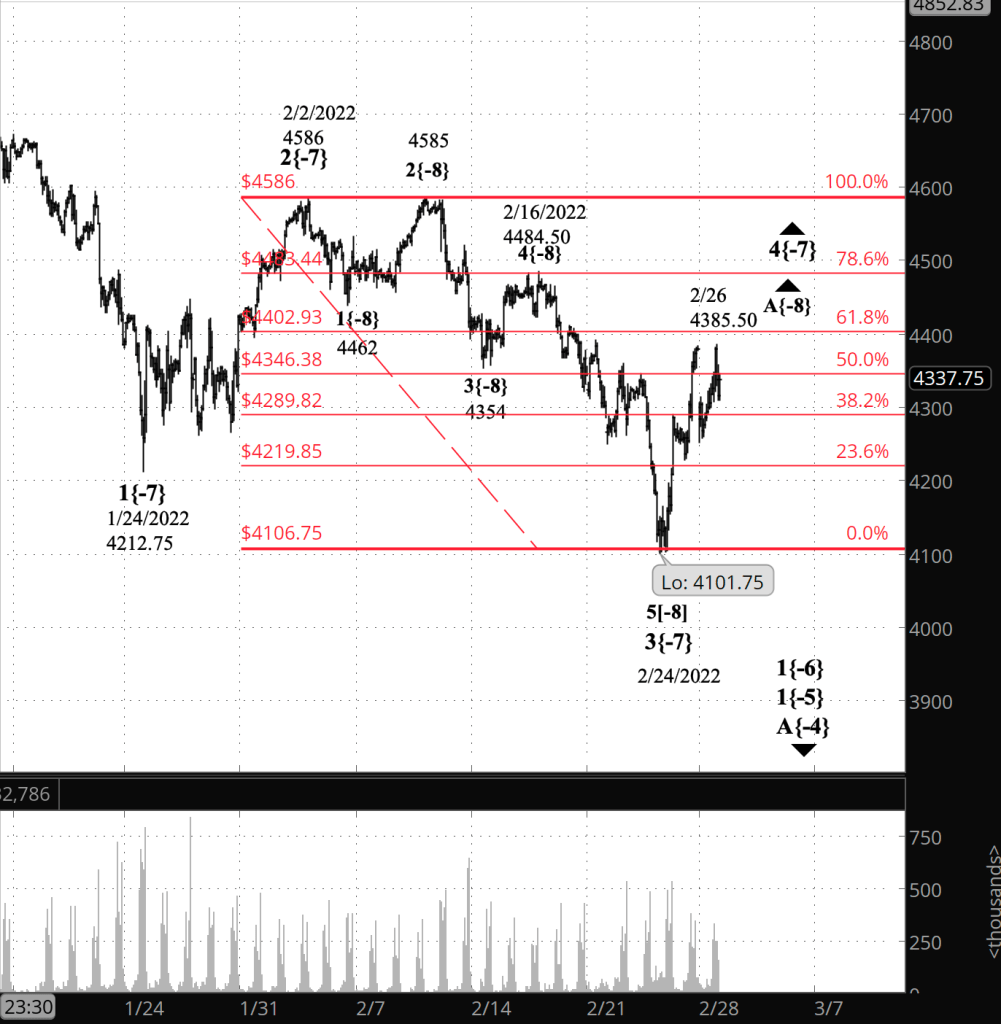
Rise to a new high for the day. The futures price reversed and rose above the January 25 high, 4384.25, to 4385.50, so far. This knocks out my principal analysis and replaces it with Alternative #1: The first leg of the upward correction continues. In Elliott terms, wave A{-8} within wave 4{-7} is still underway. I’ve updated the chart below, moving a bit closer in for clarity.
9:35 a.m. New York time
What’s happening now? The S&P 500 E-mini futures gapped downward when trading resumed Sunday evening at 4299.50, opening 81 points below Friday’s close.
What does it mean? The first leg of the low-level upward correction that began on February 24 ended the next day just below the 61.8% Fibonacci retracement level, and the second leg, to the downside, has begun. The price will remain above the January 24 low, 4212.75.
What are the alternatives? There are two:
Alternative #1: The decline from the February 25 high could be a subwave of a continuing 1st leg of the correction.
Alternative #2: The correction could have ended at the February 25 high and the downtrend has resumed today.
What does Elliott wave theory say? Under my principal analysis, wave A{-8} within wave 4{-7}, both to the upside, peaked on Friday, and wave B{-8} to the downside has begun. Under the rules of Elliott wave analysis, a 4th wave cannot move beyond the end of the preceding wave 1. Wave 1{-7} ended at 4212.75 on January 24, and wave B{-8} will remain above that level.
Alternative #1 sees the downward gap as a subwave correction within wave A{-8}, which is still climbing. This scenario will be confirmed if the price moves above the February 25 high, 4384.25.
Alternative #2 sees wave 4{-7} as having ended at the February 25 high, the endpoint of the child wave C{-8}. The decline that began from that high is an early movement within wave 5{-7} to the downside. There are two ways to in which this scenario can be confirmed: Wave B{-8} will have three subwaves, and a wave 1{-7} will have five subwaves. Also, if the price moves below the start of wave 1{-7}, at 4212.75, then Alternative #2 is confirmed.
We Are Here.
These are the waves currently in progress under my principal analysis. Each line on the list shows the wave number, with the subscript in curly brackets, the traditional degree name, the starting date, the starting price of the S&P 500 E-mini futures, and the direction of the wave.
- 5{0} Intermediate, 12/21/2018, 2316.75 (up)
- 3{1} Minor, 3/23/2018 2174 (up)
- 5{-2} Minute, 10/4/2020, 4267.50 (up)
- 4{-3} Minuette, 1/4/2022, 4808.25 (down)
- A{-4} Subminuette, 1/4/2022, 4808.25 (down)
- 1{-5} Micro, 1/4/2022, 4808.25 (down)
- 1{-6} Submicro, 1/4/2022, 4808.25 (down)
- 4{-7} Minuscule, 2/24/2022, 4101.75 (up)
- {B-8} Subminuscule, 2/25/2022, 4384.50 (down)
Learning and other resources. Elliott wave analysis provides context, not prophecy. As the 20th century semanticist Alfred Korzybski put it this way in his book Science and Sanity (1933), “The map is not the territory … The only usefulness of a map depends on similarity of structure between the empirical world and the map.” And I would add, in the ever-changing markets, we can judge that similarity of structure only after the fact.
See the menu page Analytical Methods for a rundown on where to go for information on Elliott wave analysis.
By Tim Bovee, Portland, Oregon, February 28, 2022
Disclaimer
Tim Bovee, Private Trader tracks the analysis and trades of a private trader for his own accounts. Nothing in this blog constitutes a recommendation to buy or sell stocks, options or any other financial instrument. The only purpose of this blog is to provide education and entertainment.
No trader is ever 100 percent successful in his or her trades. Trading in the stock and option markets is risky and uncertain. Each trader must make trading decisions for his or her own account, and take responsibility for the consequences.
License
All content on Tim Bovee, Private Trader by Timothy K. Bovee is licensed under a Creative Commons Attribution-ShareAlike 4.0 International License.
Based on a work at www.timbovee.com.

You must be logged in to post a comment.