3:30 p.m. New York time
Half an hour before the market close. The S&P 500 futures rose to within two points of the February 28 high, 4399, which my analysis this morning had identified as the end of wave A{-8} and the beginning of downward wave B{-8}, the middle wave within the larger wave 4{-7} upward correction. If the price moves above 4399, then this morning’s analysis, which sees wave B{-8} as being underway, must be scrapped and replaced by the alternative, which sees wave A{-8} as being still underway. As of this time the B-wave-in-progress scenario stands. And under the alternative analysis, the only change is to the interpretation of the February 28 peak. The rest of the analysis applies to both scenarios. I’ve updated the chart.
10:30 a.m. New York time
OKE earnings play exit. I’ve exited my short bull put options spread on OKE for 24.8% of maximum potential profit and have updated the entry analysis with full results.
9:35 a.m. New York time
What’s happening now? The S&P 500 E-mini futures rose from a 38.2% retracement back to a 50% retracement — both are Fibonacci levels — and then declined slightly before the opening bell.
What does it mean? The movement is consistent with my principal analysis from yesterday — the downward middle wave of an upward correction, which began on February 24, is now underway.
What’s the alternative? The upward correction ended at the February 28 high, and the subsequent decline is a resumption of the downtrend that began on January 4.
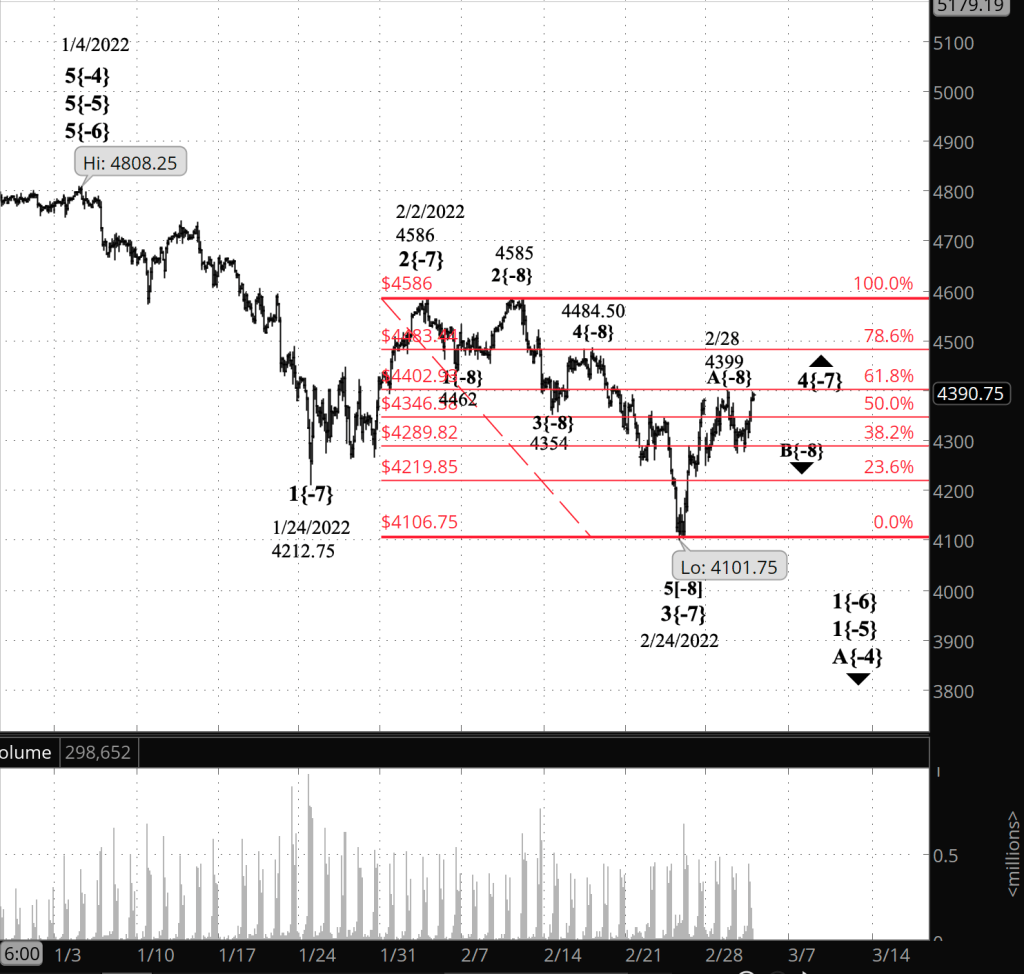
What does Elliott wave theory say? The decline from February 28 is wave B{-8} within an upward correction, wave 4{-7}, which began on February 24. All of that is happening within downtrending wave 1{-6}, which began on January 4. That 1st wave is contained within wave 1{-5} of wave A{-4}, which all began on that same day.
Wave B{-8} will be followed by upward wave C{-8}, the final wave in a three-wave corrective pattern. Under the rules of Elliott wave analysis the correction could end with the C wave. However, sometimes corrections have a compound structure, linking up to three corrective patterns together. If a compound correction forms, then upward wave C{-8} will be followed by downward wave X{-8}, which will connect the first corrective pattern with a second one. The parent wave is a 4th, and 4th waves have a greater tendency toward compound structures than do the other corrective waves, the 2nd.
When wave 4{-7} is complete, it will be followed by wave 5{-7}, which will fall below the end of the preceding 3rd wave, 4101.75 on February 24, perhaps significantly below that level. The end of wave 5{-7} will also end its parent, wave 1{-6}. The following wave 2{-6} will be an upward correction. Second waves tend to retrace a great deal of the preceding 1st wave, and so wave 2{-6} will present an opportunity to close out bullish positions before the magnitude of the subsequent wave 3{-6} decline puts the markets in panicky mood.
The alternative analysis sees the February 28 peak as the end of wave 4{-7} and the subsequent decline as the early stage of wave 5{-7}.
We Are Here.
These are the waves currently in progress under my principal analysis. Each line on the list shows the wave number, with the subscript in curly brackets, the traditional degree name, the starting date, the starting price of the S&P 500 E-mini futures, and the direction of the wave.
- 5{0} Intermediate, 12/21/2018, 2316.75 (up)
- 3{1} Minor, 3/23/2018 2174 (up)
- 5{-2} Minute, 10/4/2020, 4267.50 (up)
- 4{-3} Minuette, 1/4/2022, 4808.25 (down)
- A{-4} Subminuette, 1/4/2022, 4808.25 (down)
- 1{-5} Micro, 1/4/2022, 4808.25 (down)
- 1{-6} Submicro, 1/4/2022, 4808.25 (down)
- 4{-7} Minuscule, 2/24/2022, 4101.75 (up)
- B{-8} Subminuscule, 2/28/2022, 4399 (down)
Learning and other resources. Elliott wave analysis provides context, not prophecy. As the 20th century semanticist Alfred Korzybski put it this way in his book Science and Sanity (1933), “The map is not the territory … The only usefulness of a map depends on similarity of structure between the empirical world and the map.” And I would add, in the ever-changing markets, we can judge that similarity of structure only after the fact.
See the menu page Analytical Methods for a rundown on where to go for information on Elliott wave analysis.
By Tim Bovee, Portland, Oregon, March 2, 2022
Disclaimer
Tim Bovee, Private Trader tracks the analysis and trades of a private trader for his own accounts. Nothing in this blog constitutes a recommendation to buy or sell stocks, options or any other financial instrument. The only purpose of this blog is to provide education and entertainment.
No trader is ever 100 percent successful in his or her trades. Trading in the stock and option markets is risky and uncertain. Each trader must make trading decisions for his or her own account, and take responsibility for the consequences.
License
All content on Tim Bovee, Private Trader by Timothy K. Bovee is licensed under a Creative Commons Attribution-ShareAlike 4.0 International License.
Based on a work at www.timbovee.com.

You must be logged in to post a comment.