3:30 p.m. New York time
Half an hour before the closing bell. The S&P 500 futures so far have traded below the morning high, 4418.75, throughout the session, remaining in the region between the 61.8% and 50% retracement levels. The analysis is ambiguous. Was the morning high the end of wave A{-8} within wave 4{-7}? Or is the present decline just a mini-correction within a still rising wave A{-8}? Flip a coin. there’s no way to choose between them. I’ve updated the chart, continuing to mark it to show wave A{-8} still in progress.
10:40 a.m. New York time
MRVL earnings play entry. I’ve entered a short bull put options spread on MRVL and have posted a trade analysis.
10:15 a.m. New York time
NEM earnings play exit. I exited my short bull put options spread on NEM for 28.1% of maximum and have updated the trade analysis with full results.
9:35 a.m. New York time
What’s happening now? The S&P 500 E-mini futures broke past the prior high, 4399, in the rise that began on February 24, reaching 4418.75 at the opening bell. The rise brought the price above the 61.8% Fibonacci retracement level.
What does it mean? The first leg of the upward correction that began on February 24 is still underway.
What’s the alternative? I have no viable alternative at this point. For more on the subject, see the Elliott wave theory section below.
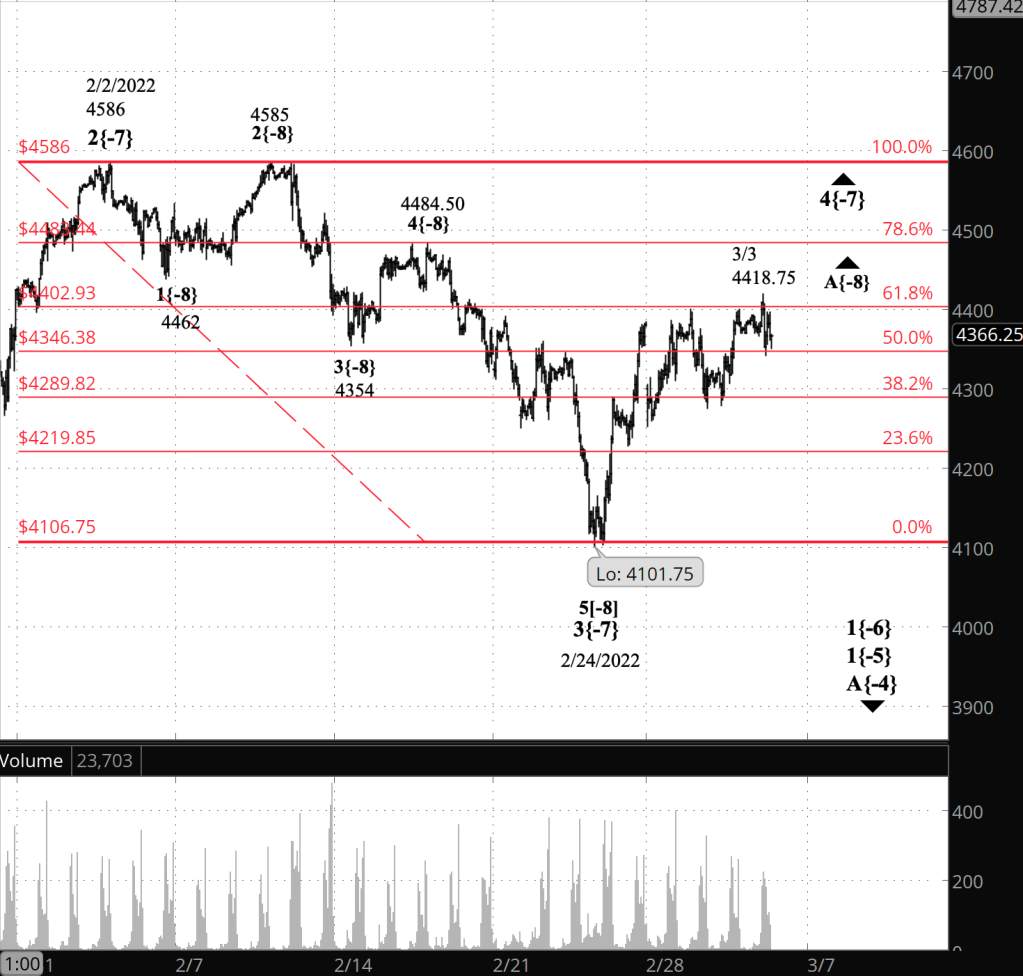
What does Elliott wave theory say? The rise is wave A{-8} within wave 4{-7}. Yesterday’s afternoon analysis counted wave A{-8} as complete at the February 28 high, 4399. Today’s break above that level invalidates that analysis in favor wave wave A{-8} continuing. Under the rules of Elliott wave analysis, a 4th wave can’t move beyond the end of the preceding 1st wave. In this case, the end of wave 1{-7} was 4586 on February 2, and that price is the upper limit of wave 4{-7}.
In analyzing the chart I considered whether the February 28 high could be considered the end of wave A{-8}, the following decline wave B{-8}, and the subsequent rise still underway as wave C{-8}. However, under Elliott’s rules, a B wave must retrace at least 90% of the preceding A wave, and the rather stunted decline after February 28 falls short. So, I’m left without an alternative this morning. Past experience being a guide, I’m quite certain that ambiguities will develop.
We Are Here.
These are the waves currently in progress under my principal analysis. Each line on the list shows the wave number, with the subscript in curly brackets, the traditional degree name, the starting date, the starting price of the S&P 500 E-mini futures, and the direction of the wave.
- 5{0} Intermediate, 12/21/2018, 2316.75 (up)
- 3{1} Minor, 3/23/2018 2174 (up)
- 5{-2} Minute, 10/4/2020, 4267.50 (up)
- 4{-3} Minuette, 1/4/2022, 4808.25 (down)
- A{-4} Subminuette, 1/4/2022, 4808.25 (down)
- 1{-5} Micro, 1/4/2022, 4808.25 (down)
- 1{-6} Submicro, 1/4/2022, 4808.25 (down)
- 4{-7} Minuscule, 2/24/2022, 4101.75 (up)
- A{-8} Subminuscule, 2/24/2022, 4101.75 (up)
Learning and other resources. Elliott wave analysis provides context, not prophecy. As the 20th century semanticist Alfred Korzybski put it this way in his book Science and Sanity (1933), “The map is not the territory … The only usefulness of a map depends on similarity of structure between the empirical world and the map.” And I would add, in the ever-changing markets, we can judge that similarity of structure only after the fact.
See the menu page Analytical Methods for a rundown on where to go for information on Elliott wave analysis.
By Tim Bovee, Portland, Oregon, March 3, 2022
Disclaimer
Tim Bovee, Private Trader tracks the analysis and trades of a private trader for his own accounts. Nothing in this blog constitutes a recommendation to buy or sell stocks, options or any other financial instrument. The only purpose of this blog is to provide education and entertainment.
No trader is ever 100 percent successful in his or her trades. Trading in the stock and option markets is risky and uncertain. Each trader must make trading decisions for his or her own account, and take responsibility for the consequences.
License
All content on Tim Bovee, Private Trader by Timothy K. Bovee is licensed under a Creative Commons Attribution-ShareAlike 4.0 International License.
Based on a work at www.timbovee.com.

You must be logged in to post a comment.