12:30 p.m. New York time
Half an hour before the closing bell. The S&P 500 futures have continued to rise during the trading session, coming close to 4300. The present wave in progress is rising wave C{-10} within an upward correction, wave 4{-9}, within downtrending wave 1{-8}. I’ve updated the chart.
9:35 a.m. New York time
What’s happening now? The S&P 500 E-mini futures rose in overnight trading, moving into the mid-4200s.
What does it mean? The rise is the third, and perhaps final, leg of an upward correction that began on March 8.
What’s the alternative? It’s possible that the upward correction ended at the March 8 high, 4275, and that the subsequent decline is a continuation of the larger downtrend that began on March 3.
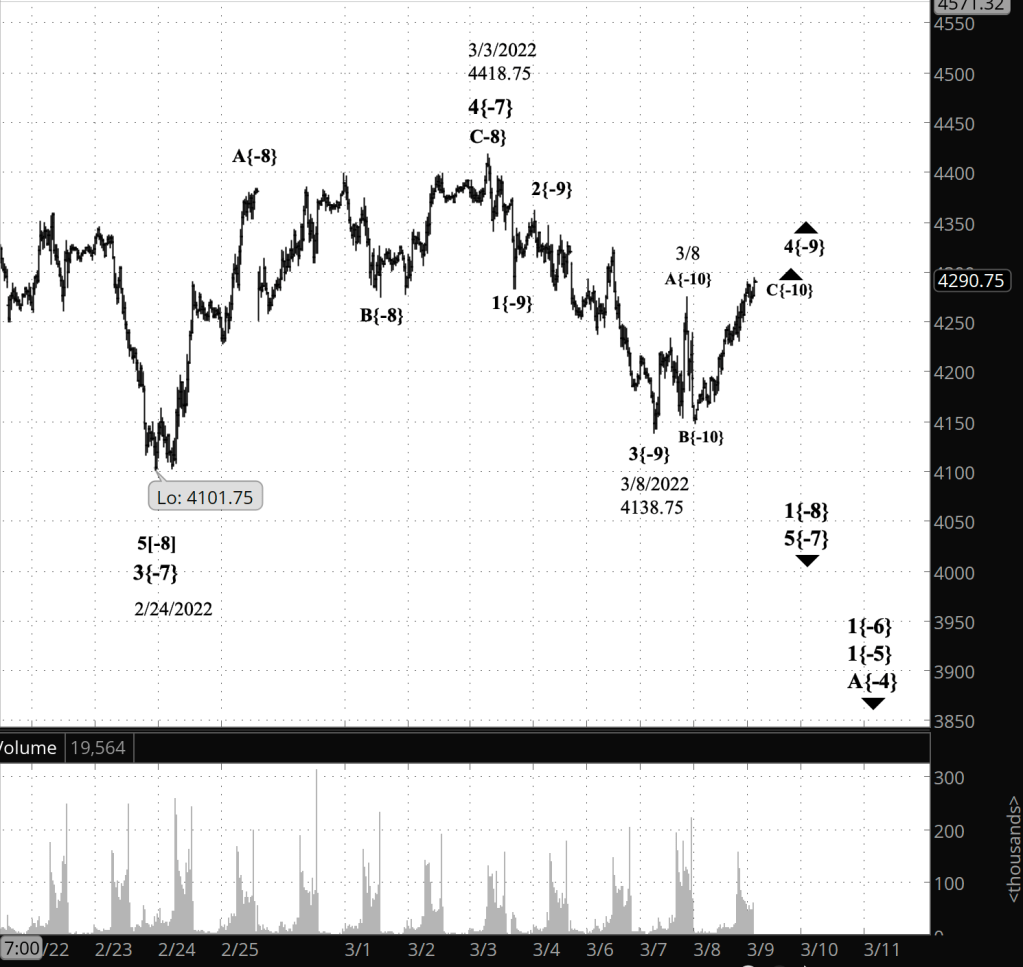
What does Elliott wave theory say? Under my principal analysis, the upward correction is wave 4{-9}, and within it, the overnight rise is wave C{-10}. Corrections tend to have three waves internally, but there is an exception. Wave 4{-9} could form a compound correction, where several three-wave corrective patterns within it are linked together. As many as three corrective patterns can be part of a compound correction. The correction is happening within wave 5{-7}, a downtrending impulse wave that began on March 3.
The alternative analysis places the end of wave 4{-9} at the March 8 high, the point labeled as the end of wave A{-10} in the principal analysis. Under this scenario, the subsequent decline is wave 5{-9}, the final wave within its parent wave 1{-8}, which began its downward trek on March 3.
Wave 4{-9} is a Flat corrective pattern, and so internally its A and B waves will have three waves internally, at the {-10} degree, and its C wave will have five waves internally. And indeed, A and B encompass three waves each.
However, wave-counting is never that simple. At a closer up view, it’s possible to see a lot of ambiguity in the count. The wave count I used in my principal analysis seems to best fit the Elliott rule set. And in either case — the principal or the alternative — the price will soon reverse, if it hasn’t already, and wave 5{-9} will carry the price down below 4101.75, the end of wave 3{-7} on February 24, and perhaps significantly below that level.
This is all happening within wave 1{-6}, which in turn is part of wave 1{-5} within wave A{-4}, all of which began on January 4 from 4808.25. Those structures are part of a downward correction, wave 4{-3}, which also began on January 4.
We Are Here.
These are the waves currently in progress under my principal analysis. Each line on the list shows the wave number, with the subscript in curly brackets, the traditional degree name, the starting date, the starting price of the S&P 500 E-mini futures, and the direction of the wave.
- 5{0} Intermediate, 12/21/2018, 2316.75 (up)
- 3{1} Minor, 3/23/2018 2174 (up)
- 5{-2} Minute, 10/4/2020, 4267.50 (up)
- 4{-3} Minuette, 1/4/2022, 4808.25 (down)
- A{-4} Subminuette, 1/4/2022, 4808.25 (down)
- 1{-5} Micro, 1/4/2022, 4808.25 (down)
- 1{-6} Submicro, 1/4/2022, 4808.25 (down)
- 5{-7} Minuscule, 3/3/2022, 4101.75 (down)
- 1{-8} Subminuscule, 3/3/2022, 4101.75 (down)
- 4{-9} Bitsy, 3/8/2022, 4178.35 (up)
Learning and other resources. Elliott wave analysis provides context, not prophecy. As the 20th century semanticist Alfred Korzybski put it in his book Science and Sanity (1933), “The map is not the territory … The only usefulness of a map depends on similarity of structure between the empirical world and the map.” And I would add, in the ever-changing markets, we can judge that similarity of structure only after the fact.
See the menu page Analytical Methods for a rundown on where to go for information on Elliott wave analysis.
By Tim Bovee, Portland, Oregon, March 9, 2022
Disclaimer
Tim Bovee, Private Trader tracks the analysis and trades of a private trader for his own accounts. Nothing in this blog constitutes a recommendation to buy or sell stocks, options or any other financial instrument. The only purpose of this blog is to provide education and entertainment.
No trader is ever 100 percent successful in his or her trades. Trading in the stock and option markets is risky and uncertain. Each trader must make trading decisions for his or her own account, and take responsibility for the consequences.
License
All content on Tim Bovee, Private Trader by Timothy K. Bovee is licensed under a Creative Commons Attribution-ShareAlike 4.0 International License.
Based on a work at www.timbovee.com.

You must be logged in to post a comment.