3:30 p.m. New York time
Half an hour before the closing bell. The S&P 500 futures fell to 4207 during the first two hours of the session, and then reversed to the upside. By my principal count, the decline was wave 1{-10} within downtrending wave 5{-9}. The rise that followed is wave 2{-10}. Second waves tend to take a Zigzag pattern, which means three subwaves labeled A, B and C. The A wave has five subwaves within it; the B, three; and the C, five.
The 2nd wave never moves beyond the start of the preceding 1st wave, so if events match my analysis, the price will remain at or below 4298.25. If it moves above that level, then my alternative analysis from this morning is correct: Wave 5{-9} hasn’t begun, but instead the upward correction, wave 4{-9}, is still underway.
I’ve updated the chart, below.
9:35 a.m. New York time
What’s happening now? The S&P 500 E-mini futures reached a high of 4298.25 in overnight trading and reversed.
What does it mean? Under my principal analysis, the downtrend that began on March 3 has resumed.
What’s the alternative? The decline that began overnight is the second wave within the final, upward movement of the correction that began on March 8.
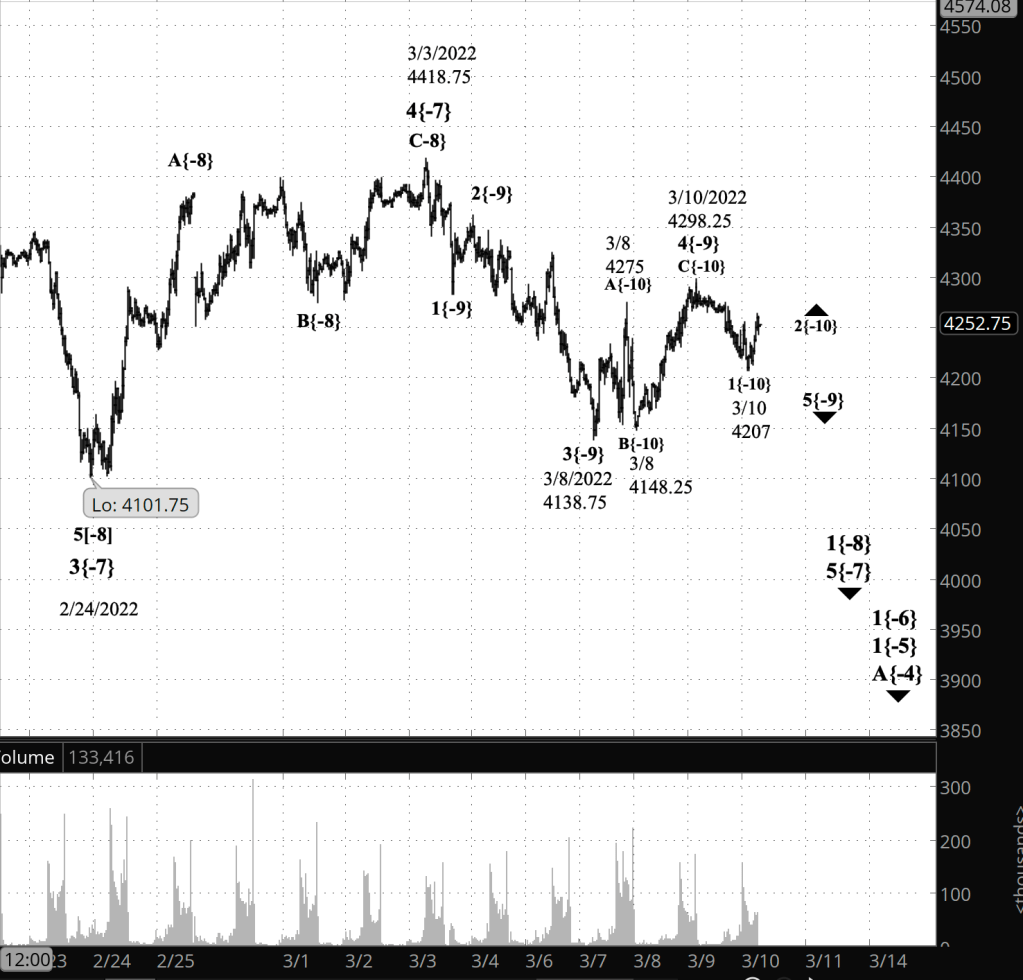
What does Elliott wave theory say? Under my principal analysis, wave C{-10} and its parent wave 4{-9} ended overnight at 4298.25. For wave C, it was a 110% retracement of the preceding wave A. The correction pattern is a Flat, and in Flats, C waves retrace from 100% to 160% of the preceding A waves. The decline, wave 5{-9}, will fall below the end of wave 3{-9}, at 4138.75 on March 8, and perhaps significantly so.
Under the alternative analysis, the overnight peak ended the first of five waves within wave C{-10} and the subsequent decline is wave 2{-11}. The price won’t move below 4148.25, the start of the preceding 1st wave.
In Elliott wave theory, waves of the same degree tend to be proportional. It’s not a firm rule — I’ve seen disproportional waves many times, especially 4th and 5th waves. But the tendency is that waves in a set will take roughly the same amount of time to complete their work. Within wave 4{-9} each subwave has lasted about a day. The principal analysis keeps that proportionality intact. The alternative analysis would make wave C significantly longer than the other two waves within wave 4{-9}.
The principal analysis will be confirmed if the price moves below 4138.75, the end of wave 3{-9}.
The alternative analysis will be tentatively confirmed if the price reverses upward significantly while above 4138.75 and entirely confirmed if it moves above 4298.25, the end of wave B{-10} within wave 4{-9}.
We Are Here.
These are the waves currently in progress under my principal analysis. Each line on the list shows the wave number, with the subscript in curly brackets, the traditional degree name, the starting date, the starting price of the S&P 500 E-mini futures, and the direction of the wave.
- 5{0} Intermediate, 12/21/2018, 2316.75 (up)
- 3{1} Minor, 3/23/2018 2174 (up)
- 5{-2} Minute, 10/4/2020, 4267.50 (up)
- 4{-3} Minuette, 1/4/2022, 4808.25 (down)
- A{-4} Subminuette, 1/4/2022, 4808.25 (down)
- 1{-5} Micro, 1/4/2022, 4808.25 (down)
- 1{-6} Submicro, 1/4/2022, 4808.25 (down)
- 5{-7} Minuscule, 3/3/2022, 4101.75 (down)
- 1{-8} Subminuscule, 3/3/2022, 4101.75 (down)
- 5{-9} Bitsy, 3/10/2022, 4298.25 (down)
- 2{-10} Subbitsy, 3/10/2022, 4207 (up)
Learning and other resources. Elliott wave analysis provides context, not prophecy. As the 20th century semanticist Alfred Korzybski put it in his book Science and Sanity (1933), “The map is not the territory … The only usefulness of a map depends on similarity of structure between the empirical world and the map.” And I would add, in the ever-changing markets, we can judge that similarity of structure only after the fact.
See the menu page Analytical Methods for a rundown on where to go for information on Elliott wave analysis.
By Tim Bovee, Portland, Oregon, March 10, 2022
Disclaimer
Tim Bovee, Private Trader tracks the analysis and trades of a private trader for his own accounts. Nothing in this blog constitutes a recommendation to buy or sell stocks, options or any other financial instrument. The only purpose of this blog is to provide education and entertainment.
No trader is ever 100 percent successful in his or her trades. Trading in the stock and option markets is risky and uncertain. Each trader must make trading decisions for his or her own account, and take responsibility for the consequences.
License
All content on Tim Bovee, Private Trader by Timothy K. Bovee is licensed under a Creative Commons Attribution-ShareAlike 4.0 International License.
Based on a work at www.timbovee.com.

[…] does it mean? By my principal analysis (yesterday’s alternative analysis), the third leg within the upward correction is still […]
LikeLike