3:30 p.m. New York time
Half an hour before the closing bell. The S&P 500 futures moved below the March 11 low, 4189, reaching 4152.25 as the closing bell approached. The decline strengthened the likelihood that the upward correction ended on March 11 at 4326.75 and that the downtrend has resumed.
Under the analysis I’ve used for the chart, the upward correction was wave 4{-9}, the downtrend is now wave 3{-10} within wave 5{-9} within wave 1{-8}. A decline below 4138.25, the end of wave 3{-9} on March 8, will confirm that wave 5{-9} is underway.
The second alternative analysis, that wave 4{-9} is still underway, had an equal likelihood of being valid this morning, but the continuing decline has lessened its chances of being a valid analysis.
I’ve updated the chart, below.
9:35 a.m. New York time
What’s happening now? The S&P 500 E-mini futures stayed within a 55-point range after trading resumed overnight, remaining above the March 11 low, 4189.
What does it mean? I see two possible analyses, each having equal likelihood.
Analysis #1. The March 11 high marks the end of the upward correction that began on March 8, and the subsequent decline is a resumption of the downtrend that began on March 3. I chose to use this scenario for the chart because it is the most proportional of the analyses compared to earlier price movements of the same degree.
Analysis #2. The March 11 high is the end of an internal wave within the upward correction that began on March 8 and which is still underway. The subsequent decline is yet another internal wave within the correction. This is the scenario I used for Friday’s chart. It is less proportional than the first analysis, however, proportionality is a tendency, not a firm rule.
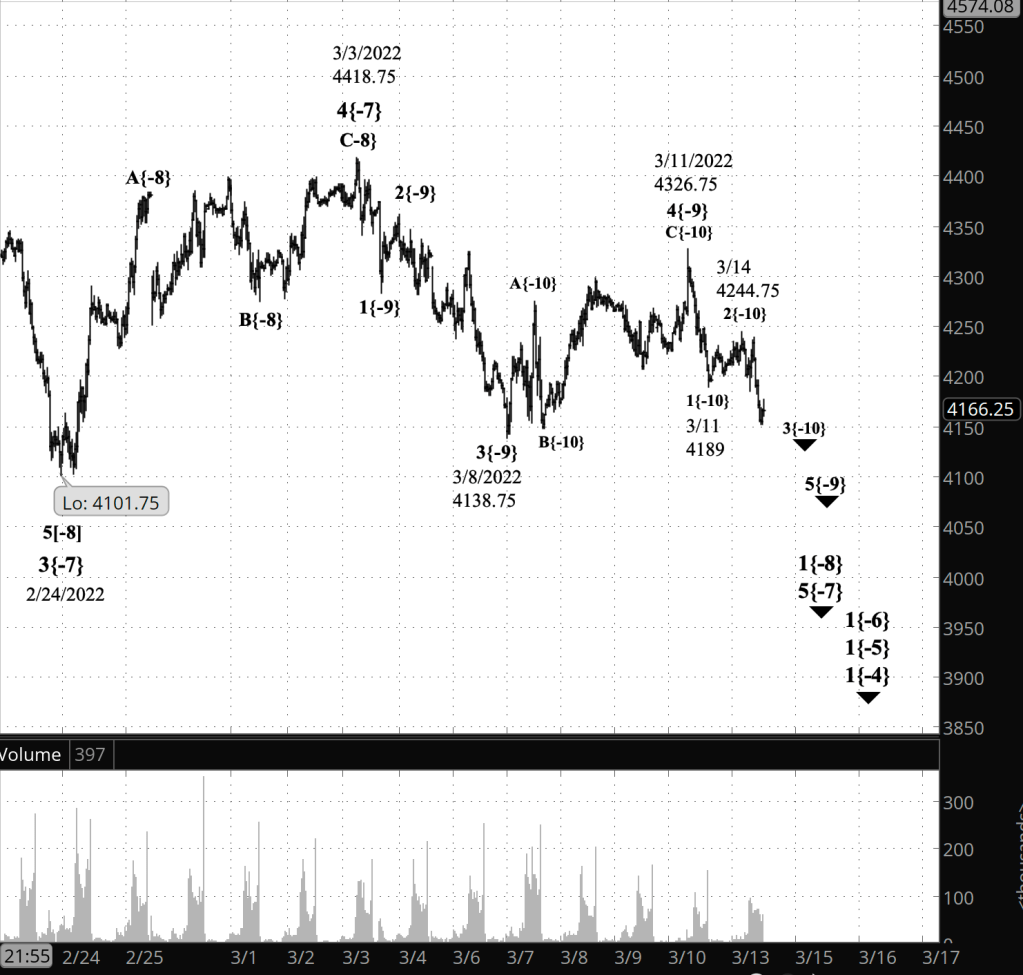
What does Elliott wave theory say? Under Analysis #1, the March 11 high, 4326.75, marks the end of wave C{-10} within an upward correction, wave 4{-9}. Under this scenario, wave 4{-9} ended midway between the 61.8% and the 78.6% Fibonacci retracement levels, which puts it within the range of the 4th subwave within the preceding wave 3, the usual end point for 4th waves that have taken the Flat pattern. The subsequent decline is wave 5{-9}, the final wave within the downtrend that began on March 3 from 4418.75. Fifth waves can be cut short or can move quite a distance. There’s no way to know which pattern wave 5{-9} will follow at this point.
Under Analysis #2, the March 11 high marks the end of A{-11} within wave C{-10} within wave 4{-9}. This scenario has the 4th wave upward correction still underway as it moves through wave B{-11} to the downside, which will be followed by C{-11} to the upside, which will complete the parent wave C{-10} and most likely the grand-parent wave 4{-9}.
Analysis #1 — declining wave 5{-9} is underway — will be strengthened if the price moves below the March 11 low, 4189, and confirmed if it moves below the March 8 low, 4138.75.
Analysis #2 — rising wave 4{-9} is underway — will be strengthened if the price moves above the overnight high, 4244.75, and confirmed if it approaches or moves above the March 11 high, 4326.75.
We Are Here.
These are the waves currently in progress under my principal analysis. Each line on the list shows the wave number, with the subscript in curly brackets, the traditional degree name, the starting date, the starting price of the S&P 500 E-mini futures, and the direction of the wave.
- Index:
- 5{0} Intermediate, 12/26/2018, 2346.58 (up)
- 4{-1} Minor, 1/4/2022 4818.62 (down)
- 1{-2} Minute, 1/4/2022 4818.62 (down)
- Futures and index:
- 1{-3} Minuette, 1/4/2022, 4808.25 (down) (futures), 4818.62 (down) (index)
- Futures:
- 1{-4} Subminuette, 1/4/2022, 4808.25 (down)
- 1{-5} Micro, 1/4/2022, 4808.25 (down)
- 1{-6} Submicro, 1/4/2022, 4808.25 (down)
- 5{-7} Minuscule, 3/3/2022, 4101.75 (down)
- 1{-8} Subminuscule, 3/3/2022, 4101.75 (down)
- 5{-9} Bitsy, 3/11/2022, 4326.75 (down)
- 3{-10} Subbitsy, 3/11/2022, 4244.75 (down)
Learning and other resources. Elliott wave analysis provides context, not prophecy. As the 20th century semanticist Alfred Korzybski put it in his book Science and Sanity (1933), “The map is not the territory … The only usefulness of a map depends on similarity of structure between the empirical world and the map.” And I would add, in the ever-changing markets, we can judge that similarity of structure only after the fact.
See the menu page Analytical Methods for a rundown on where to go for information on Elliott wave analysis.
By Tim Bovee, Portland, Oregon, March 14, 2022
Disclaimer
Tim Bovee, Private Trader tracks the analysis and trades of a private trader for his own accounts. Nothing in this blog constitutes a recommendation to buy or sell stocks, options or any other financial instrument. The only purpose of this blog is to provide education and entertainment.
No trader is ever 100 percent successful in his or her trades. Trading in the stock and option markets is risky and uncertain. Each trader must make trading decisions for his or her own account, and take responsibility for the consequences.
License
All content on Tim Bovee, Private Trader by Timothy K. Bovee is licensed under a Creative Commons Attribution-ShareAlike 4.0 International License.
Based on a work at www.timbovee.com.

You must be logged in to post a comment.