3:30 p.m. New York time
Half an hour before the closing bell. The S&P 500 futures spent the day in a narrow range, having risen less than 125 points from the overnight low as the closing bell approached, then then retreating a little. No change in the analysis. I’ve updated the chart.
3 p.m. New York time
GM earnings play exit. I’ve exited my short bull put options spread on GM for a loss and have updated the trading analysis with results.
12:05 p.m. New York time
FB earnings play assignment and exit. My deep in the money short put options on FB, part of a bull put spread position, were assigned three days before expiration. I exited the shares resulting from assignment and also the remaining long puts, and have put it altogether as combined results in an update to the trade analysis.
9:35 a.m. New York time
What’s happening now? The S&P 500 E-mini futures declined to 4129.50 in overnight trading and then rose slightly.
What does it mean? The downtrend that began on January 4 and resumed on March 3 after an upward correction continues.
What’s the alternative? The upward correction that began on February 24 is still underway.
The chart. I’ve moved the view further out to show the entire downtrend that began on January 4 from 4808.25 and that continues today.
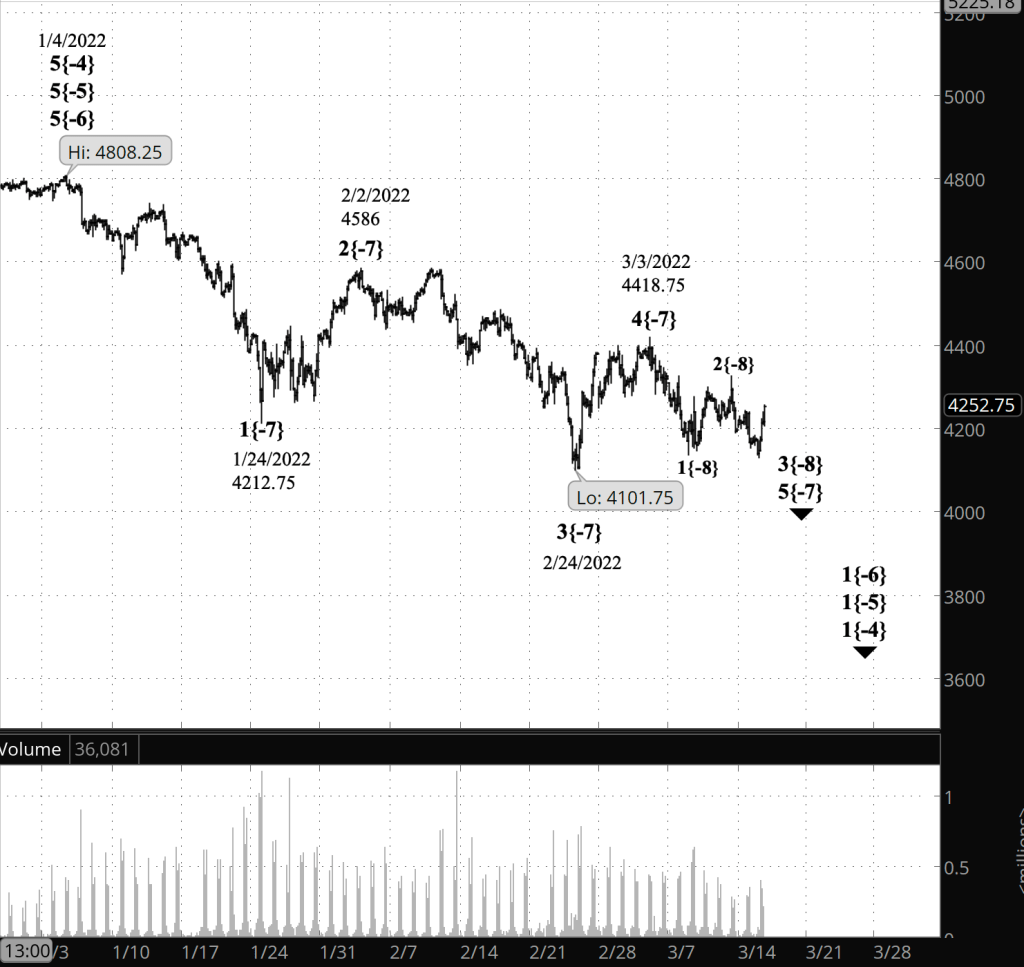
What does Elliott wave theory say? Note that I’ve moved the degrees higher since March 11 compared to Monday’s analysis.
Under my principal count the downtrend, wave 3{-8} within wave 5{-7} is underway.
Under my alternative analysis, wave 4{-7} is still underway, having retraced 91% of the preceding wave 3{-7} and is in its middle wave, B{-8}.
We Are Here.
These are the waves currently in progress under my principal analysis. Each line on the list shows the wave number, with the subscript in curly brackets, the traditional degree name, the starting date, the starting price of the S&P 500 E-mini futures, and the direction of the wave.
- Index:
- 5{0} Intermediate, 12/26/2018, 2346.58 (up)
- 4{-1} Minor, 1/4/2022 4818.62 (down)
- 1{-2} Minute, 1/4/2022 4818.62 (down)
- Futures and index:
- 1{-3} Minuette, 1/4/2022, 4808.25 (down) (futures), 4818.62 (down) (index)
- Futures:
- 1{-4} Subminuette, 1/4/2022, 4808.25 (down)
- 1{-5} Micro, 1/4/2022, 4808.25 (down)
- 1{-6} Submicro, 1/4/2022, 4808.25 (down)
- 5{-7} Minuscule, 3/3/2022, 4101.75 (down)
Learning and other resources. Elliott wave analysis provides context, not prophecy. As the 20th century semanticist Alfred Korzybski put it in his book Science and Sanity (1933), “The map is not the territory … The only usefulness of a map depends on similarity of structure between the empirical world and the map.” And I would add, in the ever-changing markets, we can judge that similarity of structure only after the fact.
See the menu page Analytical Methods for a rundown on where to go for information on Elliott wave analysis.
By Tim Bovee, Portland, Oregon, March 15, 2022
Disclaimer
Tim Bovee, Private Trader tracks the analysis and trades of a private trader for his own accounts. Nothing in this blog constitutes a recommendation to buy or sell stocks, options or any other financial instrument. The only purpose of this blog is to provide education and entertainment.
No trader is ever 100 percent successful in his or her trades. Trading in the stock and option markets is risky and uncertain. Each trader must make trading decisions for his or her own account, and take responsibility for the consequences.
License
All content on Tim Bovee, Private Trader by Timothy K. Bovee is licensed under a Creative Commons Attribution-ShareAlike 4.0 International License.
Based on a work at www.timbovee.com.

You must be logged in to post a comment.