3:30 p.m. New York time
Half an hour before the closing bell. The S&P 500 has continued to decline from this morning peak, 4339.75 on the futures. The analysis is unchanged from the revisions posted at 2:45 p.m., below. I’ve updated the upper, close-up chart.
2:45 p.m. New York time
A new analysis. A close-up look at the chart following the Federal Open Market Committee’s statement requires an update to my principal analysis.
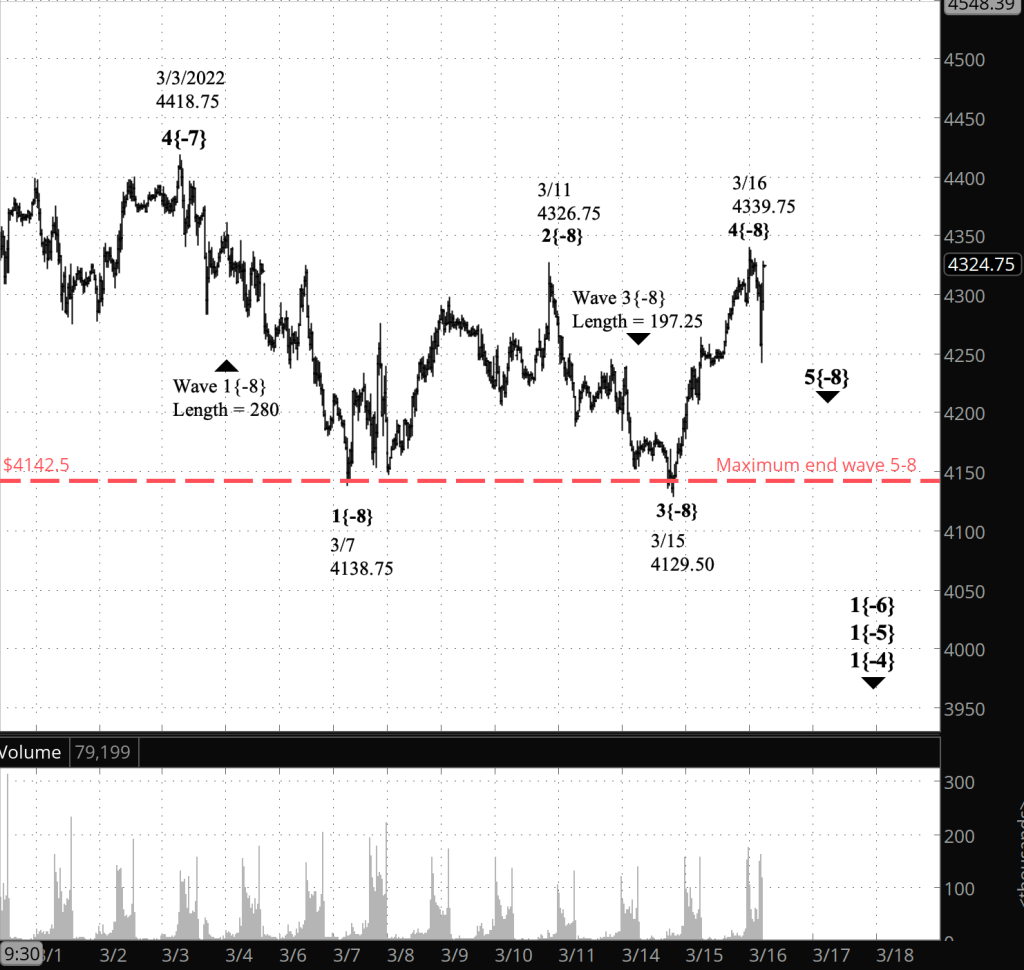
As I wrote this morning, the rise from the March 15 low is an upward correction, wave 4{-8}. Internally, it has three waves, as expected of a correction. It ended today at 4339.75, an hour before the Fed statement, and then began to decline as wave 5{-8}. Under this scenario, the middle wave, 3{-8}, is shorter than the preceding 1st wave.
The rules of Elliott wave analysis say that a 3rd wave can’t be shorter than both waves 1 and 5. So, the brevity of wave 3{-8} sets a lower boundary on the ensuing wave 5{-8}, to ensure that the 5th wave is no longer than the 3rd. Wave 3{-8} was 197.25 points long on the S&P 500 futures. Therefore, wave 5{-8} can move no lower than 4142.50, 13 points above the end of the preceding 1st wave. Such a condition is called a truncated 5th wave.
The revised alternative analysis labels today’s peak, 4339.75, as the end of wave A{-9} within wave 4{-8} — the upward correction — and the subsequent decline is wave B{-9}. A 4th wave cannot move beyond the end of the preceding wave 1, which is 4138.75. If wave B{-9} within wave 4{-8} moves below that level, then the count will need to be revised.
If the price within wave 5{-8} moves below 4142.50, then the count will be revised to place the end of wave 2{-8} at today’s high, 4339.75, and the subsequent decline would be wave 3{-8} to the downside, with no restriction on how far down it can go. Honestly, I’m not certain that the lower degree counts from March 7 will support such a hypothetical 2nd wave. Wave counts have a lot of ambiguity, especially in assigning the degree, and so I suspect it might be possible to find a count to fit the chart.
Charts. I’ve added a new upper chart, with close-up view. I’ve retained the lower chart from this morning’s analysis.
10 a.m. New York time
HAL earnings play exit. I’m continuing to close out my losing positions built from options that expire on Friday, March 18. Today I exited the puts on a short iron condor on HAL and expect the out-of-the-money calls to expire without a debit. I’ve updated the trade analysis with the puts results and a best-case scenario for the full position.
9:40 a.m. New York time
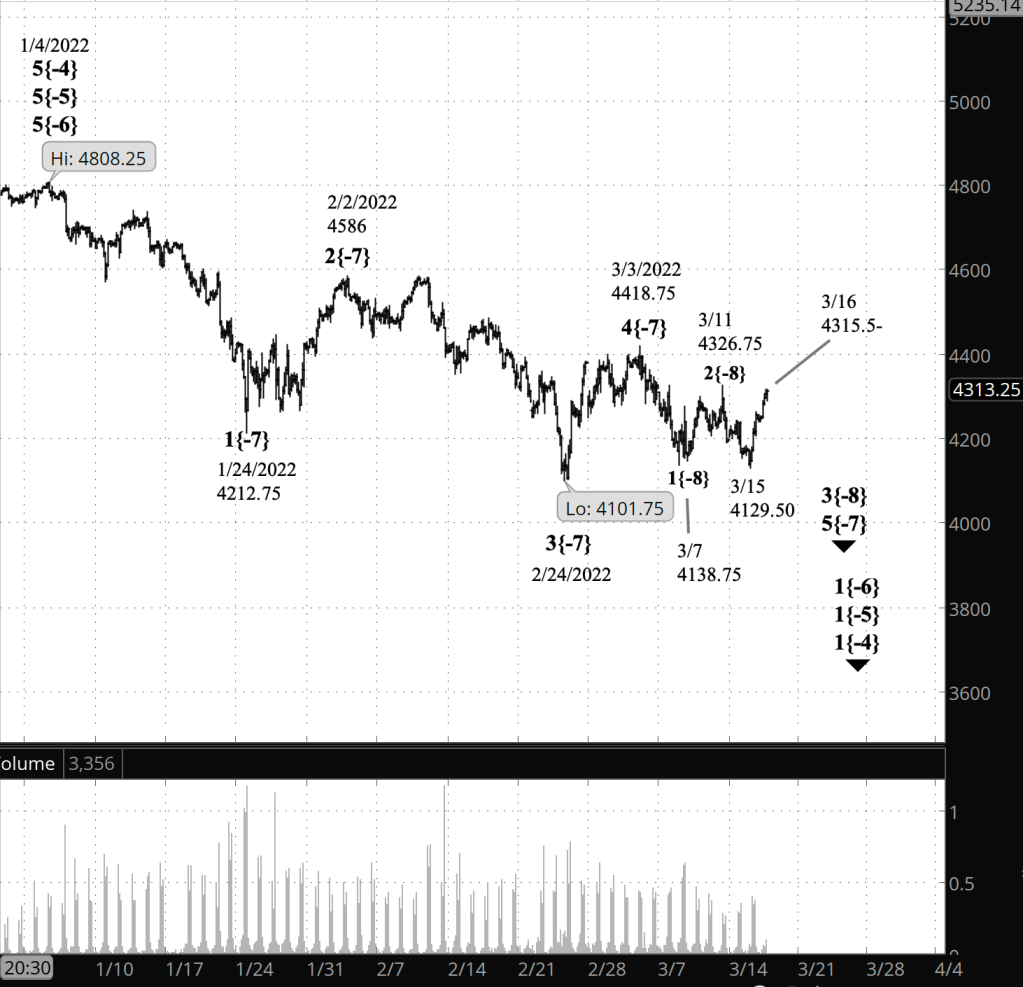
What’s happening now? The S&P 500 E-mini futures rose sharply in overnight trading to 4315.50, coming to within 11 points of yesterday’s high.
What does it mean? The rise is a low-degree upward correction that began on March 15 within the ongoing downtrend is underway.
What’s the alternative? The larger upward correction that began March 7 is still underway. This will become more likely if the price exceeds the March 11 high, 4236.75, although even then, the principal analysis can’t be rejected.
What does Elliott wave theory say? We’ve once again entered one of those periods of great ambiguity. This one will be resolved quite swiftly, I suspect.
Under principal analysis, the rise is wave 2{-9} within an ongoing wave 3{-8}. It has retraced 98% of the preceding 1st wave. One downside of this analysis is that it produces a very small 3rd wave — 188 points — which is smaller than wave 1, and which means the future wave 5 would have to be even shorter to avoid tripping over a firm rule of Elliott — the 3rd can’t be shorter than both waves 1 and 3.
If the price rises above 4326.75, the end of wave 2{-8}, then it becomes increasingly possible that wave 2{-8}, an upward correction, is in fact still underway, with the March 11 peak being the end of wave A{-9}, the March 15 low the end of wave B{-9}, and wave C{-9} to the upside being currently underway. But it’s not a certainty. The rules of Elliott wave analysis don’t prohibit a 3rd wave from being beyond the start of preceding wave 3.
We Are Here.
These are the waves currently in progress under my principal analysis. Each line on the list shows the wave number, with the subscript in curly brackets, the traditional degree name, the starting date, the starting price of the S&P 500 E-mini futures, and the direction of the wave.
- Index:
- 5{0} Intermediate, 12/26/2018, 2346.58 (up)
- 4{-1} Minor, 1/4/2022 4818.62 (down)
- 1{-2} Minute, 1/4/2022 4818.62 (down)
- Futures and index:
- 1{-3} Minuette, 1/4/2022, 4808.25 (down) (futures), 4818.62 (down) (index)
- Futures:
- 1{-4} Subminuette, 1/4/2022, 4808.25 (down)
- 1{-5} Micro, 1/4/2022, 4808.25 (down)
- 1{-6} Submicro, 1/4/2022, 4808.25 (down)
- 5{-7} Minuscule, 3/3/2022, 4101.75 (down)
- 1{-8} Subminuscule, 3/3/2022, 4101.75 (down)
- 5{-9} Bitsy, 3/11/2022, 4326.75 (down)
- 3{-10} Subbitsy, 3/11/2022, 4244.75 (down)
Learning and other resources. Elliott wave analysis provides context, not prophecy. As the 20th century semanticist Alfred Korzybski put it in his book Science and Sanity (1933), “The map is not the territory … The only usefulness of a map depends on similarity of structure between the empirical world and the map.” And I would add, in the ever-changing markets, we can judge that similarity of structure only after the fact.
See the menu page Analytical Methods for a rundown on where to go for information on Elliott wave analysis.
By Tim Bovee, Portland, Oregon, March 16, 2022
Disclaimer
Tim Bovee, Private Trader tracks the analysis and trades of a private trader for his own accounts. Nothing in this blog constitutes a recommendation to buy or sell stocks, options or any other financial instrument. The only purpose of this blog is to provide education and entertainment.
No trader is ever 100 percent successful in his or her trades. Trading in the stock and option markets is risky and uncertain. Each trader must make trading decisions for his or her own account, and take responsibility for the consequences.
License
All content on Tim Bovee, Private Trader by Timothy K. Bovee is licensed under a Creative Commons Attribution-ShareAlike 4.0 International License.
Based on a work at www.timbovee.com.

[…] discussed in the afternoon revision in yesterday’s post, wave 5{-8} has limited downward potential. Wave 3 is shorter than wave 1. Under the rules of […]
LikeLike
[…] discussed in the March 15 Trader’s Notebook, a 3rd wave cannot be shorter than both waves 1 and 5 in a five-wave trending pattern. That firm […]
LikeLike