3:30 p.m. New York time
Half an hour before the closing bell. The S&P 500 peaked shortly after the opening bell, at 4473 on the futures, and then declined slightly. The upward correction, wave 4{-7} has taken the form of a Flat, and within that form, wave C will have five waves within it. Wave C{-8} is in its fifth wave internally, wave 5{-9}. It’s very short so far, which is allowed under the rules of Elliott wave analysis — a truncated 5th. So today’s high could be the end of wave C{-8} and its parent, wave 4{-7}. But not necessarily. The lower the price falls, the more likely it is that the upward correction has ended and 5{-7} to the downside has begun.
No change in the analysis. I’ve updated the chart.
9:40 a.m. New York time
NFLX earnings play expires. My final position built from the March options, a short iron condor earnings play on NFLX, expired for a loss after the closing bell on Friday. I’ve updated the trade analysis with full results.
9:35 a.m. New York time
What’s happening now? The S&P 500 E-mini futures stayed in a narrow range after trading resumed overnight, remaining below Friday’s peak, 4465.75.
What does it mean? The upward correction that began on February 24 continues and in its last phase. It will be followed by a resumption of the downtrend that began on January 4, which will carry the price below 4101.75, perhaps significantly so.
What’s the alternative? It’s possible that the correction is forming a compound correction, linking two or three corrective patterns together, and in doing so delaying the resumption of the downtrend.
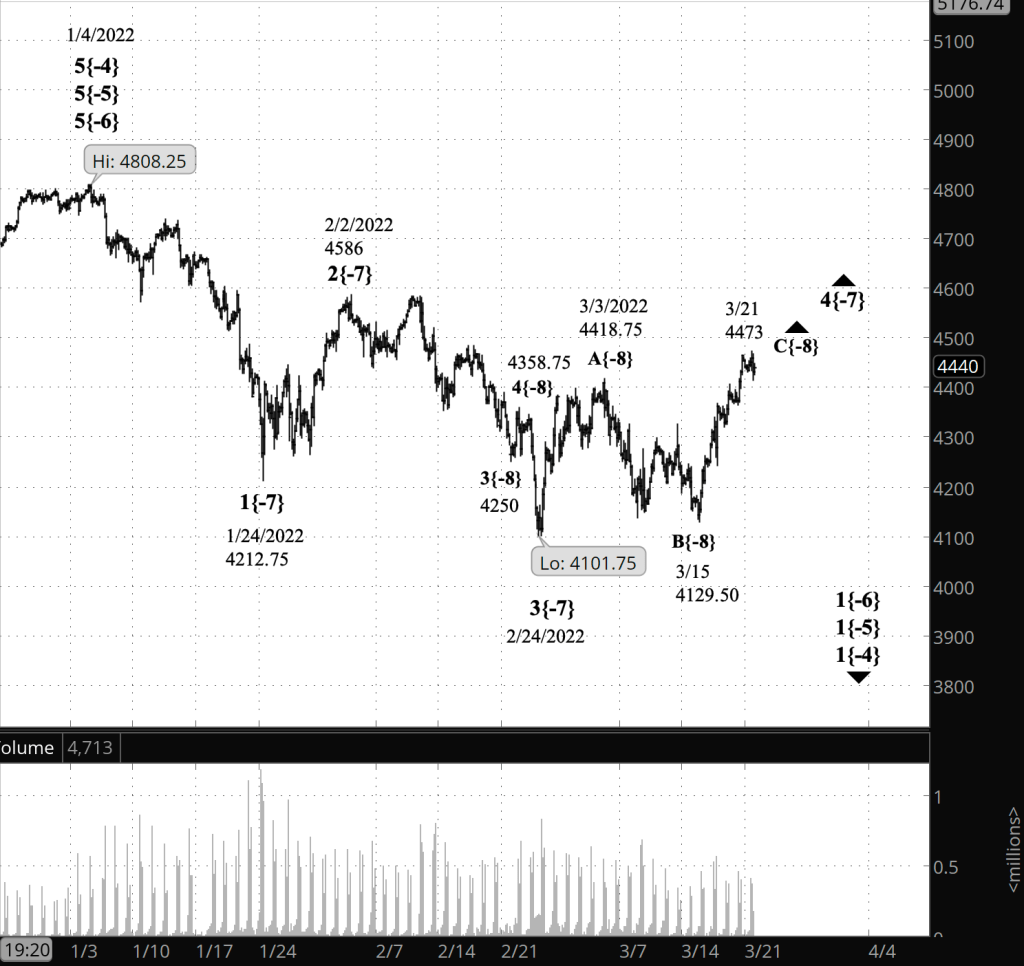
What does Elliott wave theory say? I worked with the chart Friday evening and over the weekend and have again re-analyzed the wave labels. The length of the rise from March 15 makes it imperative to change the count that showed unusually short wave 3{-8} that ended on March 15 at 4129.50.
As discussed in the March 15 Trader’s Notebook, a 3rd wave cannot be shorter than both waves 1 and 5 in a five-wave trending pattern. That firm rule of Elliott wave analysis limited the downward reach of the future wave 5{-8} so that it would be shorter than the preceding wave 3{-8}. The higher wave 4{-8} went, the less likely that count became.
In re-analyzing the count, I’ve changed the ending of the parent wave 4{-7} from March 3 at 4418.75 to some future point. The wave is still underway. What had been labeled the end of wave 4{-7} is now the end of wave A{-8} within 4{-7}, followed by wave B{-8} ending on March 15 at 4129.50. Wave C{-8} is underway.
That analysis solves the problem of the overly short 3rd wave by pushing wave 5{-8} into the future, as the final wave of wave 5{-7}, which has not yet begun.
A 4th wave often ends in the range of the smaller 4th wave within the preceding 3rd wave, in this case, within wave 4{-8} within wave 3{-7}. which I’ve labeled on the chart. That range runs from 4250 to 4358.75. Friday’s high, 4465.75, exceeds that target by seven points. That’s a long way of saying that wave 4{-7} may be nearing its end. Although it’s not guaranteed; the target range is a tendency, not a rule.
Under the alternative count, the present wave C{-8} within wave 4{-7} will be followed by a connecting wave X{-8} and then by a second three-wave corrective pattern, such as a Flat or a Zigzag. That second pattern could, when complete, be the end of wave 4{-7}, or it a could be followed by a third corrective pattern, the largest number allowed by the Elliott wave rules in a compound correction.
In any case, whether under the principal analysis or the alternative, the final corrective pattern ending wave 4{-7} will be followed by wave 5{-7}, a resumption of the downtrend that opened the year when it began on January 4. All of this is happening within the parent, downtrending wave 1{-6}, which also began on January 4.
We Are Here.
These are the waves currently in progress under my principal analysis. Each line on the list shows the wave number, with the subscript in curly brackets, the traditional degree name, the starting date, the starting price of the S&P 500 E-mini futures, and the direction of the wave.
- Index:
- 5{0} Intermediate, 12/26/2018, 2346.58 (up)
- 4{-1} Minor, 1/4/2022 4818.62 (down)
- 1{-2} Minute, 1/4/2022 4818.62 (down)
- Futures and index:
- 1{-3} Minuette, 1/4/2022, 4808.25 (down) (futures), 4818.62 (down) (index)
- Futures:
- 1{-4} Subminuette, 1/4/2022, 4808.25 (down)
- 1{-5} Micro, 1/4/2022, 4808.25 (down)
- 1{-6} Submicro, 1/4/2022, 4808.25 (down)
- 4{-7} Minuscule, 3/3/2022, 4101.75 (up)
- C{-8} Subminuscule, 3/15/2022, 4129.50 (up}
Learning and other resources. Elliott wave analysis provides context, not prophecy. As the 20th century semanticist Alfred Korzybski put it in his book Science and Sanity (1933), “The map is not the territory … The only usefulness of a map depends on similarity of structure between the empirical world and the map.” And I would add, in the ever-changing markets, we can judge that similarity of structure only after the fact.
See the menu page Analytical Methods for a rundown on where to go for information on Elliott wave analysis.
By Tim Bovee, Portland, Oregon, March 21, 2022
Disclaimer
Tim Bovee, Private Trader tracks the analysis and trades of a private trader for his own accounts. Nothing in this blog constitutes a recommendation to buy or sell stocks, options or any other financial instrument. The only purpose of this blog is to provide education and entertainment.
No trader is ever 100 percent successful in his or her trades. Trading in the stock and option markets is risky and uncertain. Each trader must make trading decisions for his or her own account, and take responsibility for the consequences.
License
All content on Tim Bovee, Private Trader by Timothy K. Bovee is licensed under a Creative Commons Attribution-ShareAlike 4.0 International License.
Based on a work at www.timbovee.com.

You must be logged in to post a comment.