3:30 p.m. New York time
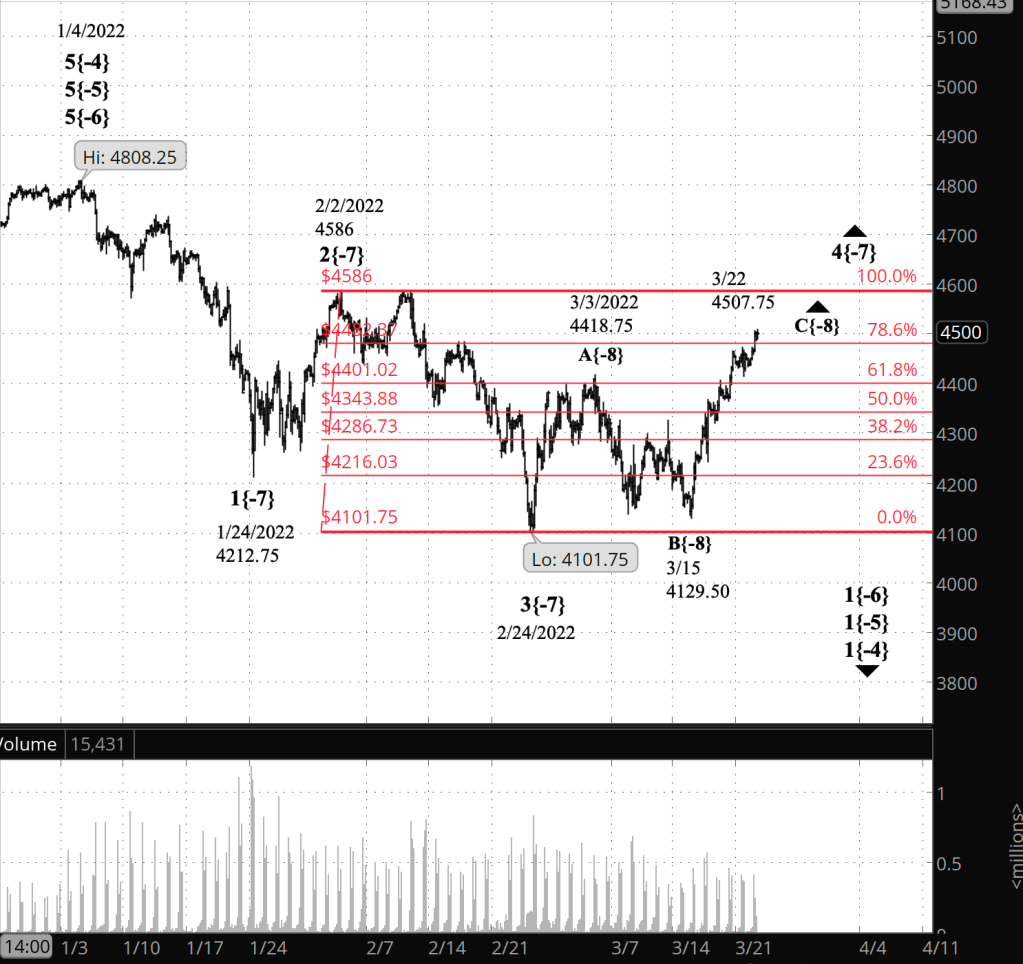
Half an hour before the closing bell. The S&P 500 has reached a high of 4507.75 so far today during an upward correction that began on February 24. The correction, wave 4{-7}, internally is in its third leg, wave C{-8}. The C wave will most likely complete the 4th wave rise, although the correction could prove to be a compound structure, connecting several corrective patterns together, as discussed this morning.
I’ve superimposed a Fibonacci retracement grid over the chart, to better understand the extent of the rising 4th wave’s retracement of the declining 3rd that came before it. In today’s session the price moved slightly above the 78.6% Fibonacci retracement level. Fib levels are often the regions where waves reverse direction. It’s a tendency, not a guarantee.
No change in the analysis. I’ve updated the chart.
9:40 a.m. New York time
What’s happening now? The S&P 500 E-mini futures traded in a narrow range overnight, edging up to a new high, above 4479, after the opening bell..
What does it mean? The upward correction that began on February 24 continues and is in its last phase. Upon its completion, the downtrend that began on January 4 will resume, bringing the price below 4101.75, and perhaps significantly below that level.
What are the alternatives? There are two:
Alternative #1: The correction has met its minimum criteria and may have ended at today’s high.
Alternative #2: The correction will follow its initial corrective pattern with a second corrective pattern and perhaps a third in a compound correction, delaying resumption of the downtrend.
What does Elliott wave theory say? Under my principal analysis, wave C{-8}, the final wave within a rising correction, wave 4{-7}, is still underway.
Under alternative #1, wave 4{-7} ended at today’s high, and the subsequent decline is the first tentative step in a resumption of the downtrend as wave 5{-7}..
Under alternative #2, wave C{-8} within wave 4{-7} will be followed by a downward connector wave, X{-8}, which in turn will be followed by a second corrective patterns. Up to three patterns can be strung together in a compound correction.
Both the principal and the alternatives are occurring within wave 1{-6}, a downtrend that began on January 4 from 4808.25. The end of wave 5{-7} will also be the end of wave 1{-6}, and afterward it will begin an upward correction, wave 2{-6}, in a Flat pattern that may well retrace a large portion of the preceding decline. As a Flat, however, wave 2{-6} must remain below 4808.25, the starting point of wave 1{-6}.
We Are Here.
These are the waves currently in progress under my principal analysis. Each line on the list shows the wave number, with the subscript in curly brackets, the traditional degree name, the starting date, the starting price of the S&P 500 E-mini futures, and the direction of the wave.
- Index:
- 5{0} Intermediate, 12/26/2018, 2346.58 (up)
- 4{-1} Minor, 1/4/2022 4818.62 (down)
- 1{-2} Minute, 1/4/2022 4818.62 (down)
- Futures and index:
- 1{-3} Minuette, 1/4/2022, 4808.25 (down) (futures), 4818.62 (down) (index)
- Futures:
- 1{-4} Subminuette, 1/4/2022, 4808.25 (down)
- 1{-5} Micro, 1/4/2022, 4808.25 (down)
- 1{-6} Submicro, 1/4/2022, 4808.25 (down)
- 4{-7} Minuscule, 3/3/2022, 4101.75 (up)
- C{-8} Subminuscule, 3/15/2022, 4129.50 (up}
Learning and other resources. Elliott wave analysis provides context, not prophecy. As the 20th century semanticist Alfred Korzybski put it in his book Science and Sanity (1933), “The map is not the territory … The only usefulness of a map depends on similarity of structure between the empirical world and the map.” And I would add, in the ever-changing markets, we can judge that similarity of structure only after the fact.
See the menu page Analytical Methods for a rundown on where to go for information on Elliott wave analysis.
By Tim Bovee, Portland, Oregon, March 22, 2022
Disclaimer
Tim Bovee, Private Trader tracks the analysis and trades of a private trader for his own accounts. Nothing in this blog constitutes a recommendation to buy or sell stocks, options or any other financial instrument. The only purpose of this blog is to provide education and entertainment.
No trader is ever 100 percent successful in his or her trades. Trading in the stock and option markets is risky and uncertain. Each trader must make trading decisions for his or her own account, and take responsibility for the consequences.
License
All content on Tim Bovee, Private Trader by Timothy K. Bovee is licensed under a Creative Commons Attribution-ShareAlike 4.0 International License.
Based on a work at www.timbovee.com.

You must be logged in to post a comment.