3:30 p.m. New York time
Half an hour before the closing bell. The S&P 500 has fallen throughout the session, with futures reaching 4465.75 at the lowest point, remaining below yesterday’s high, 4514.75. No change in the analysis. I’ve updated the chart.
10:55 a.m. New York time
DRI earnings play entry. I’ve entered a bear call vertical spread on DRI, using options that expire on May 20, and have posted an analysis of the trade.
9:35 a.m. New York time
What’s happening now? The S&P 500 E-mini futures declined in overnight trading, reversing from yesterday’s high, 4517.75, attained in the last half hour of the session.
What does it mean? The upward correction that began on February 24 from 4101.75 is still underway, having risen more than 500 points from the low to the high. It is in its final phase.
What are the alternatives? Yesterday’s high may have been the end the correction. The further down the pullback from that high travels, the more likely it is that the downtrend that began on January 4 has resumed, carrying the price below 4101.75, perhaps quite a bit lower.
It’s possible that the correction is forming a compound structure, connecting two or three corrective patterns together. If that’s the case, then the price will pull back in a connecting move and then swing into a second corrective pattern within a compound correction.
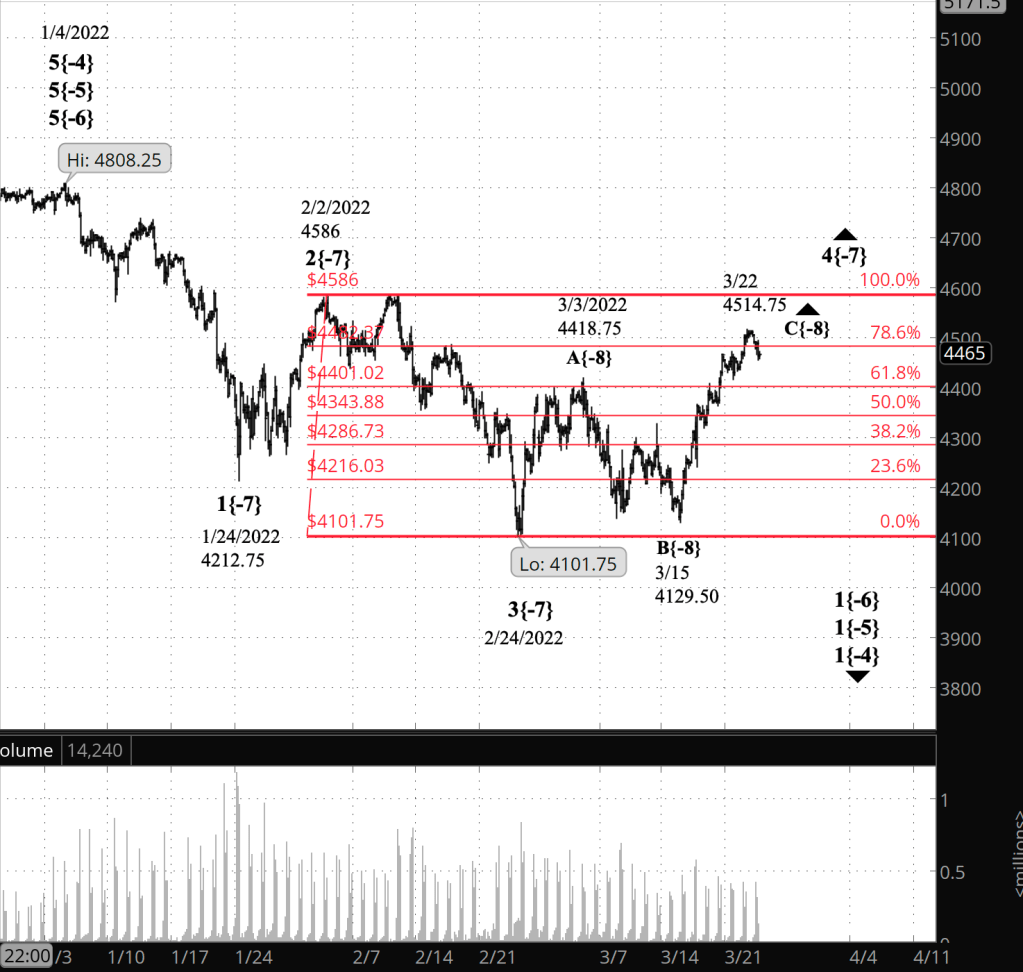
What does Elliott wave theory say? Wave 4{-7}, the upward correction that began on February 24, is in its last internal segment, wave C{-8}. The C wave will have five waves internally, and that’s the wave count I see, with the usual ambiguities built into analog structures.
So the question we face with wave 4{-7} is straight out of Shakespeare’s Hamlet: “To be or not to be”. If the price reverses from its present level, at the 78.6% Fibonacci mark, and rises further, then wave 4{-7} is underway — the principal analysis. If the price continues to decline, then downtrending wave 5{-7} began on March 22 and will carry the price down into the 4100s and most likely lower.
If the price declines but stays above the start of the correction, 4101.75, and then rises again, then wave 4{-7} is forming a compound correction. The decline after the first corrective pattern will be wave X{-8} and will be followed by a second corrective pattern, most likely formed by three waves internally (unless it’s a Triangle of some sort).
In any case, once wave 5{-7} reaches an end, it will also be the end of the parent, downtrending wave 1{-6}, which began on January 4 from 4808.75. It will be followed by a 2nd wave correction that will carry price up significantly, perhaps into the price range we saw yesterday.
We Are Here.
These are the waves currently in progress under my principal analysis. Each line on the list shows the wave number, with the subscript in curly brackets, the traditional degree name, the starting date, the starting price of the S&P 500 E-mini futures, and the direction of the wave.
- Index:
- 5{0} Intermediate, 12/26/2018, 2346.58 (up)
- 4{-1} Minor, 1/4/2022 4818.62 (down)
- 1{-2} Minute, 1/4/2022 4818.62 (down)
- Futures and index:
- 1{-3} Minuette, 1/4/2022, 4808.25 (down) (futures), 4818.62 (down) (index)
- Futures:
- 1{-4} Subminuette, 1/4/2022, 4808.25 (down)
- 1{-5} Micro, 1/4/2022, 4808.25 (down)
- 1{-6} Submicro, 1/4/2022, 4808.25 (down)
- 4{-7} Minuscule, 3/3/2022, 4101.75 (up)
- C{-8} Subminuscule, 3/15/2022, 4129.50 (up}
Learning and other resources. Elliott wave analysis provides context, not prophecy. As the 20th century semanticist Alfred Korzybski put it in his book Science and Sanity (1933), “The map is not the territory … The only usefulness of a map depends on similarity of structure between the empirical world and the map.” And I would add, in the ever-changing markets, we can judge that similarity of structure only after the fact.
See the menu page Analytical Methods for a rundown on where to go for information on Elliott wave analysis.
By Tim Bovee, Portland, Oregon, March 23, 2022
Disclaimer
Tim Bovee, Private Trader tracks the analysis and trades of a private trader for his own accounts. Nothing in this blog constitutes a recommendation to buy or sell stocks, options or any other financial instrument. The only purpose of this blog is to provide education and entertainment.
No trader is ever 100 percent successful in his or her trades. Trading in the stock and option markets is risky and uncertain. Each trader must make trading decisions for his or her own account, and take responsibility for the consequences.
License
All content on Tim Bovee, Private Trader by Timothy K. Bovee is licensed under a Creative Commons Attribution-ShareAlike 4.0 International License.
Based on a work at www.timbovee.com.

You must be logged in to post a comment.