3:30 p.m. New York time
Half an hour before the closing bell. The S&P 500 rose during the trading session, reaching 4555.75, slightly above the the overnight low. No change in the analysis. I’ve updated the chart below.
11:20 a.m. New York time
MKC earnings play entry. I’ve entered a short bull put options spread on MKC and have posted an analysis of the trade.
9:35 a.m. New York time
What’s happening now? The S&P 500 E-mini futures continued to rise after trading resumed overnight, reaching a high so far today of 4548.50.
What does it mean? The upward correction that began on February 24 continues and is in its final phase, both at its top degree and at least two degrees smaller. Bottom line: It will be over soon.
What are the alternatives? There are two:
Alternative #1: The correction has met all of the requirements set out by Elliott wave theory, and so any peak, including today’s, could be the end of the correction. The end of the correction will be followed by a significant decline as the downtrend that began on January 4 resumes. Bottom line: It’s over.
Alternative #2: The present corrective pattern could be followed by a second corrective pattern and possibly a third. In such a compound correction, the first pattern is followed by a connecting wave — a decline in this case — and if the correction extends to three waves, the second wave is also followed by a downward connecting wave. When complete, the downtrendd from January 4 will resume. Bottom line: It’s not going to be over as quickly as we expected.
Chart. For today’s chart, I’ve moved in closer to focus on the upward correction, with the goal of seeing more clearly how far advanced it is.
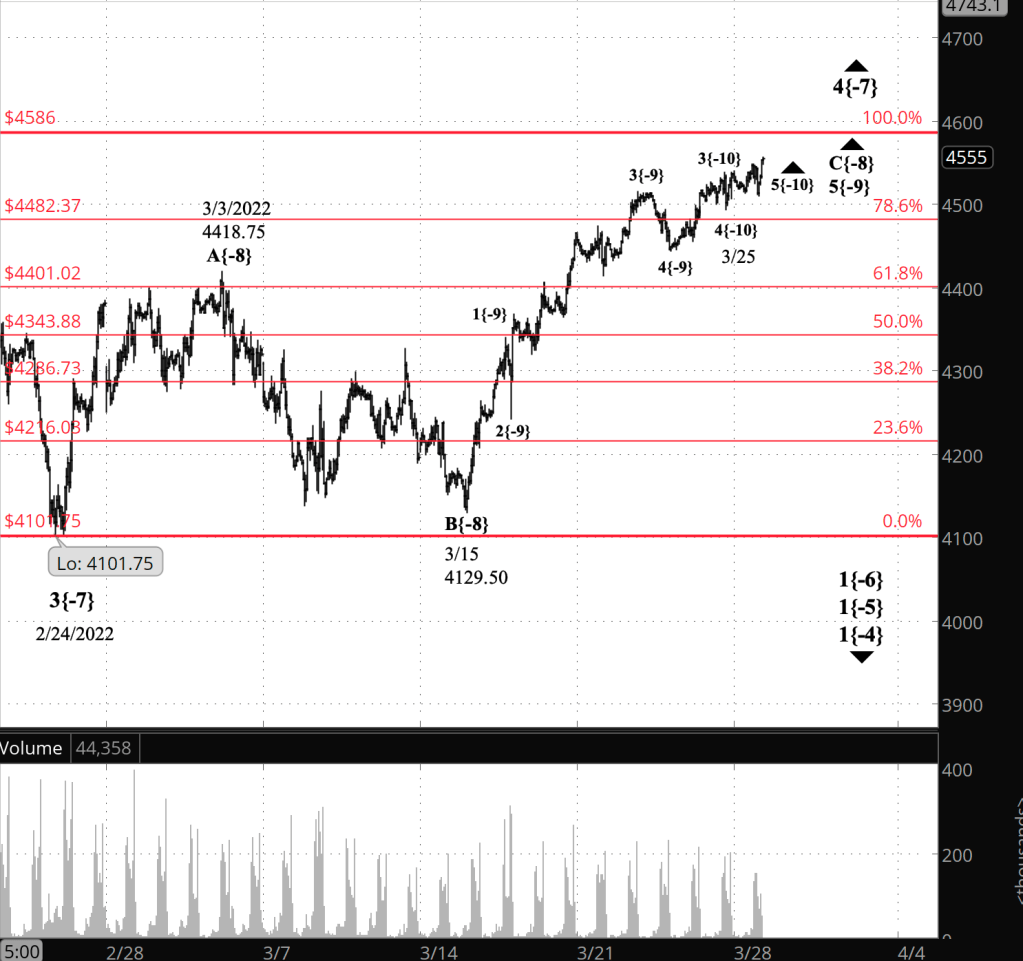
What does Elliott wave theory say? Under my principal analysis, wave 4{-7}, the upward correction that began on February 24, is underway. Internally, it is in its final wave, C{-8}, if it is structured as a simple correction. C waves in both Flats and Zigzags have five waves internally, and in this case, rising wave 5{-9} is underway, having begun on March 25.
Wave 4{-7} is constrained in that it cannot move above 4808.25, the starting point of wave 1{-7} on January 4.
When wave 4{-7} is complete, it will be followed by wave 5{-7}, a resumption of the downtrend that began on January 4 that will most likely carry the price below 4101.75, the wave 4{-7} starting point, perhaps significantly lower.
Under Alternative #1, the overnight high, 4548.50, is the end of wave 4{-7} and its internal waves. The subsequent decline is the small beginning of what will turn out to be a significant wave 5{-7} decline to 4101.75 and lower.
Under Alternative #2, the end of the present wave C{-8} will be followed by downward wave X{-8}, a connecting wave that will in turn be followed by a second corrective pattern in a compound correction. Such compound structures can have up to three corrective patterns, each separated from the prior pattern by an X wave. When the final pattern is complete, the downtrend will resume as wave 5{-7}.
We Are Here.
These are the waves currently in progress under my principal analysis. Each line on the list shows the wave number, with the subscript in curly brackets, the traditional degree name, the starting date, the starting price of the S&P 500 E-mini futures, and the direction of the wave.
- Index:
- 5{0} Intermediate, 12/26/2018, 2346.58 (up)
- 4{-1} Minor, 1/4/2022 4818.62 (down)
- 1{-2} Minute, 1/4/2022 4818.62 (down)
- Futures and index:
- 1{-3} Minuette, 1/4/2022, 4808.25 (down) (futures), 4818.62 (down) (index)
- Futures:
- 1{-4} Subminuette, 1/4/2022, 4808.25 (down)
- 1{-5} Micro, 1/4/2022, 4808.25 (down)
- 1{-6} Submicro, 1/4/2022, 4808.25 (down)
- 4{-7} Minuscule, 3/3/2022, 4101.75 (up)
- C{-8} Subminuscule, 3/15/2022, 4129.50 (up}
Learning and other resources. Elliott wave analysis provides context, not prophecy. As the 20th century semanticist Alfred Korzybski put it in his book Science and Sanity (1933), “The map is not the territory … The only usefulness of a map depends on similarity of structure between the empirical world and the map.” And I would add, in the ever-changing markets, we can judge that similarity of structure only after the fact.
See the menu page Analytical Methods for a rundown on where to go for information on Elliott wave analysis.
By Tim Bovee, Portland, Oregon, March 28, 2022
Disclaimer
Tim Bovee, Private Trader tracks the analysis and trades of a private trader for his own accounts. Nothing in this blog constitutes a recommendation to buy or sell stocks, options or any other financial instrument. The only purpose of this blog is to provide education and entertainment.
No trader is ever 100 percent successful in his or her trades. Trading in the stock and option markets is risky and uncertain. Each trader must make trading decisions for his or her own account, and take responsibility for the consequences.
License
All content on Tim Bovee, Private Trader by Timothy K. Bovee is licensed under a Creative Commons Attribution-ShareAlike 4.0 International License.
Based on a work at www.timbovee.com.

You must be logged in to post a comment.