3:30 p.m. New York time
Half an hour before the closing bell. The S&P 500 stayed below the March 29 high, 4631 on the futures, during the trading session, and in the afternoon dropped below the 161.8% Fibonacci retracement level of the preceding downward movement that began on March 3. The upward movement from March 15 is wave C{-8} within wave 4{-7}. The C-wave retracement is of the prior B-wave downward movement. No change in the analysis. I’ve updated the chart below.
11:30 a.m. New York time
WBA earnings play entry. I’ve entered a short iron condor position on WBA, timed to coincide with tomorrow’s earnings announcement, using options that expire on May 20, and have posted an analysis of the trade.
11:10 a.m. New York time
PVH earnings play exit. I’ve exited my short bear call options spread on PVH for 30% of maximum potential profit and have updated the analysis with full results.
10:55 a.m. New York time
MU earnings play exit. I’ve exited my short bull put options spread on MU for 45% of maximum potential profit and have updated the analysis with full results.
9:35 a.m. New York time
What’s happening now? The S&P 500 E-mini futures remained below Tuesday’s high, 4631, in overnight trading, tracing a sideways path.
What does it mean? The upward correction that began on February 24 continues. It is most likely nearing an end and when complete, will be followed by a resumption of the downtrend that began on January 4, which will carry the price down toward the 4100 level and possibly below.
What are the alternatives? The two alternatives describe two possibilities: The correction has already ended, and the correction is forming a complex pattern that will delay its end.
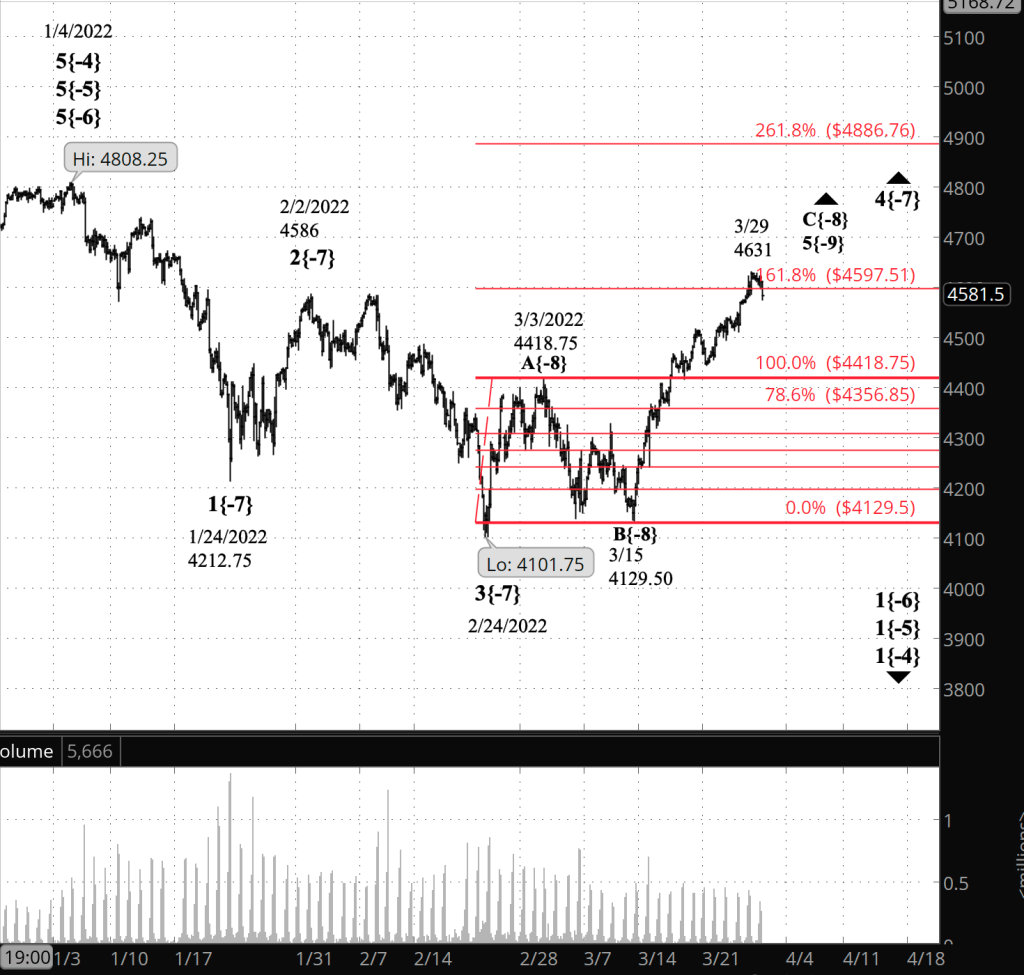
What does Elliott wave theory say? The upward correction is wave 4{-7}, which began on February 24 from 4101.75, within wave 1{-6}, which began on January 4 from 4808.25. Wave 4{-7} is internally in its final wave, C{-8}, which has retraced the proceeding B wave by a Fibonacci 161.8%, indicating a Flat pattern.
Principal analysis: Wave 4{-7} has a bit more upside remaining, but it has fulfilled the requirements of Elliott wave analysis for 4th waves and could end at any time.
Alternative #1: Wave 4{-7} ended on March 29 at 4631 and the downtrend has resumed, wave 5{-7}. Fifth waves sometimes come up short, but most move beyond the end of the preceding 3rd wave, 4101.75 in this case.
Alternative #2: Most 4th waves end after three internal waves, with wave C{-8} in this instance. Sometimes, however, they form a compound structure, connecting two or the three-wave patterns. The correcting wave, moving downward in this case, would be wave X{-8} and would be followed by three more waves in a second corrective pattern. As in the other possibilities, once the correction in complete, the downtrend will resume as wave 5{-7}.
We Are Here.
These are the waves currently in progress under my principal analysis. Each line on the list shows the wave number, with the subscript in curly brackets, the traditional degree name, the starting date, the starting price of the S&P 500 E-mini futures, and the direction of the wave.
- Index:
- 5{0} Intermediate, 12/26/2018, 2346.58 (up)
- 4{-1} Minor, 1/4/2022 4818.62 (down)
- 1{-2} Minute, 1/4/2022 4818.62 (down)
- Futures and index:
- 1{-3} Minuette, 1/4/2022, 4808.25 (down) (futures), 4818.62 (down) (index)
- Futures:
- 1{-4} Subminuette, 1/4/2022, 4808.25 (down)
- 1{-5} Micro, 1/4/2022, 4808.25 (down)
- 1{-6} Submicro, 1/4/2022, 4808.25 (down)
- 4{-7} Minuscule, 3/3/2022, 4101.75 (up)
- C{-8} Subminuscule, 3/15/2022, 4129.50 (up}
Learning and other resources. Elliott wave analysis provides context, not prophecy. As the 20th century semanticist Alfred Korzybski put it in his book Science and Sanity (1933), “The map is not the territory … The only usefulness of a map depends on similarity of structure between the empirical world and the map.” And I would add, in the ever-changing markets, we can judge that similarity of structure only after the fact.
See the menu page Analytical Methods for a rundown on where to go for information on Elliott wave analysis.
By Tim Bovee, Portland, Oregon, March 30, 2022
Disclaimer
Tim Bovee, Private Trader tracks the analysis and trades of a private trader for his own accounts. Nothing in this blog constitutes a recommendation to buy or sell stocks, options or any other financial instrument. The only purpose of this blog is to provide education and entertainment.
No trader is ever 100 percent successful in his or her trades. Trading in the stock and option markets is risky and uncertain. Each trader must make trading decisions for his or her own account, and take responsibility for the consequences.
License
All content on Tim Bovee, Private Trader by Timothy K. Bovee is licensed under a Creative Commons Attribution-ShareAlike 4.0 International License.
Based on a work at www.timbovee.com.

[…] Under the second alternative, wave 4{-7} is forming a compound correction, linking several corrective patterns together, as described in greater detail in yesterday’s analysis. […]
LikeLike