3:30 p.m. New York time
Half an hour before the closing bell. Shortly after the opening bell, the S&P 500 E-mini futures fell below the 161.8% 4th wave Fibonacci retracement of the preceding 2nd wave. The price has remained below that level so far in the session.
This morning’s principal analysis had uptrending wave 4{-7} still underway, with the price potentially rising above the March 29 high, 4631, sometimes in the future. The further the price retreats from that level, the greater the likelihood that wave 4{-7} has ended and downtrending wave 5{-7} has begun, the latter being the first alternate analysis from this morning.
Wave 4{-7} has fulfilled the minimum requirements of a 4th wave, as has the present internal wave, C{-8}. So basically it’s a flip of the coin to choose between the two analyses.
A downward correction within wave C{-8} will have three subwaves, and the first wave within downtrending wave 5{-7} will have five subwaves, and so as those patterns emerge they may help shed some light on whether wave 4{-7} has ended or not.
No change in the analysis. I’ve updated the chart.
11:35 a.m. New York time
Trading rules: shares. I’ve revised my trading rules for trading shares. The new version can be found here or at anytime on the Trading Rules tab at the top of each page.
10:20 a.m. New York time
MKC earnings play exit. I exited my short bull put vertical options spread on MKC for 24.8% of maximum potential profit and have updated the trade analysis with full results.
9:55 a.m. New York time
What’s happening now? The S&P 500 E-mini futures remained within the narrow range of the last three days, below the March 29 high of 4631 and tracking close to the 161.8% retracement of the rise that began on March 15.
What does it mean? The correction that began on February 24 continues, and within that correction, the third leg that began on March 15 has stalled, a condition that often signals that a reversal is ahead.
What are the alternatives? There are two:
#1: The rise from March 15 may have ended with the March 29 high and the sideways hesitancy we’re seeing now may be the first, tentative steps of a resumption of the larger downtrend that began on January 4.
#2: The correction may be forming a compound structure, linking several corrective patterns together.
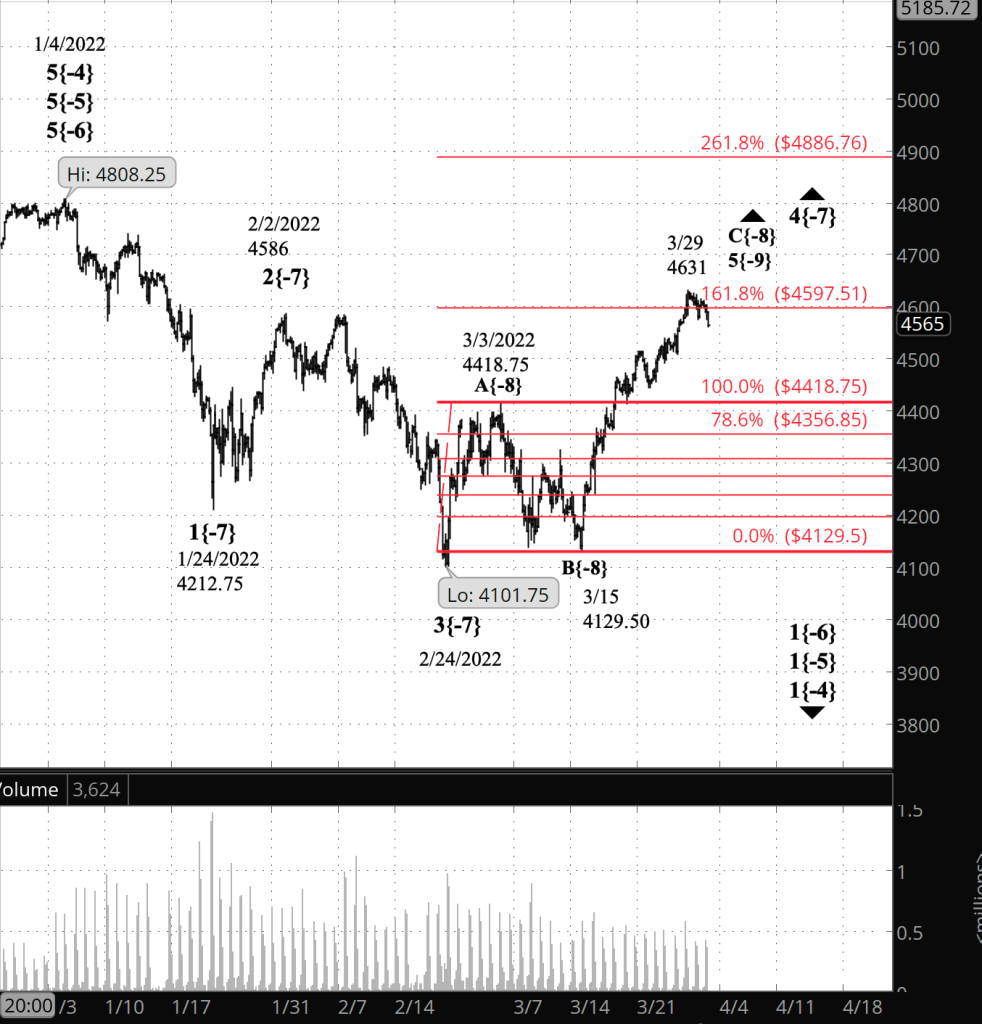
What does Elliott wave theory say? Under the principal analysis, wave C{-8}, which began on March 15, and its parent, wave 4{-7}, are still underway but has stalled, suggesting that it may move slightly higher before reversing and as wave 5{-7} resuming the decline, wave 1{-6}, that began on January 4.
Under the first alternative, wave C{-8} peaked on March 29, ending the parent wave 4{-7}, and wave 5{-7} has been underway since then.
Under the second alternative, wave 4{-7} is forming a compound correction, linking several corrective patterns together, as described in greater detail in yesterday’s analysis.
We Are Here.
These are the waves currently in progress under my principal analysis. Each line on the list shows the wave number, with the subscript in curly brackets, the traditional degree name, the starting date, the starting price of the S&P 500 E-mini futures, and the direction of the wave.
- Index:
- 5{0} Intermediate, 12/26/2018, 2346.58 (up)
- 4{-1} Minor, 1/4/2022 4818.62 (down)
- 1{-2} Minute, 1/4/2022 4818.62 (down)
- Futures and index:
- 1{-3} Minuette, 1/4/2022, 4808.25 (down) (futures), 4818.62 (down) (index)
- Futures:
- 1{-4} Subminuette, 1/4/2022, 4808.25 (down)
- 1{-5} Micro, 1/4/2022, 4808.25 (down)
- 1{-6} Submicro, 1/4/2022, 4808.25 (down)
- 4{-7} Minuscule, 3/3/2022, 4101.75 (up)
- C{-8} Subminuscule, 3/15/2022, 4129.50 (up}
Learning and other resources. Elliott wave analysis provides context, not prophecy. As the 20th century semanticist Alfred Korzybski put it in his book Science and Sanity (1933), “The map is not the territory … The only usefulness of a map depends on similarity of structure between the empirical world and the map.” And I would add, in the ever-changing markets, we can judge that similarity of structure only after the fact.
See the menu page Analytical Methods for a rundown on where to go for information on Elliott wave analysis.
By Tim Bovee, Portland, Oregon, March 31, 2022
Disclaimer
Tim Bovee, Private Trader tracks the analysis and trades of a private trader for his own accounts. Nothing in this blog constitutes a recommendation to buy or sell stocks, options or any other financial instrument. The only purpose of this blog is to provide education and entertainment.
No trader is ever 100 percent successful in his or her trades. Trading in the stock and option markets is risky and uncertain. Each trader must make trading decisions for his or her own account, and take responsibility for the consequences.
License
All content on Tim Bovee, Private Trader by Timothy K. Bovee is licensed under a Creative Commons Attribution-ShareAlike 4.0 International License.
Based on a work at www.timbovee.com.

[…] decline that has followed in order to better see the internal structure of each. See the chart in yesterday’s Trader’s Notebook for a view of the entire downtrend that began on January […]
LikeLike