3:30 p.m. New York time
Half an hour before the closing bell. The S&P 500 fell to 4501.25 on the futures and then reversed, rising by nearly 40 points. Wave 5{-9} within wave 1{-8} is underway. It is a resumption of the downtrend that began on January 4.
I’ve mentioned from time to time in earlier analyses how ambiguous the degree of waves in a new trend are. There’s no context. And such is the case with today’s chart. I’ve labeled the waves within the downtrend that began on March 29 — wave 1{-8} within wave 5{-7} — as being of the {-9} degree. But they could well be one or two degrees smaller.
The bump up from the session low could be the beginning of a correction within downtrending wave 5{-9}, or it could be something. Impossible to say at this point.
This morning’s analysis is unchanged. I’ve updated the chart.
9:35 a.m. New York time
What’s happening now? The S&P 500 E-mini futures traded sideways overnight after a sharp decline in the last hour of Thursday’s trading session.
What does it mean? The pattern of the chart since the March 29 peak is consistent with a resumption of the downtrend that began on January 4, and I’ve marked the chart that way. The upward correction that began on February 24 has ended, and the downtrend is again underway.
What are the alternatives? There are two:
Alternative #1: The March 29 peak and the subsequent decline are downward corrections within the upward correction, which is still underway.
Alternative #2: The upward correction is forming a compound structure, and the decline is a connecting wave that will be followed by another corrective pattern.
The Chart. I’ve focused on the final leg (wave C{-8} of the upward correction (wave 4{-7}) and the decline that has followed in order to better see the internal structure of each. See the chart in yesterday’s Trader’s Notebook for a view of the entire downtrend that began on January 4.
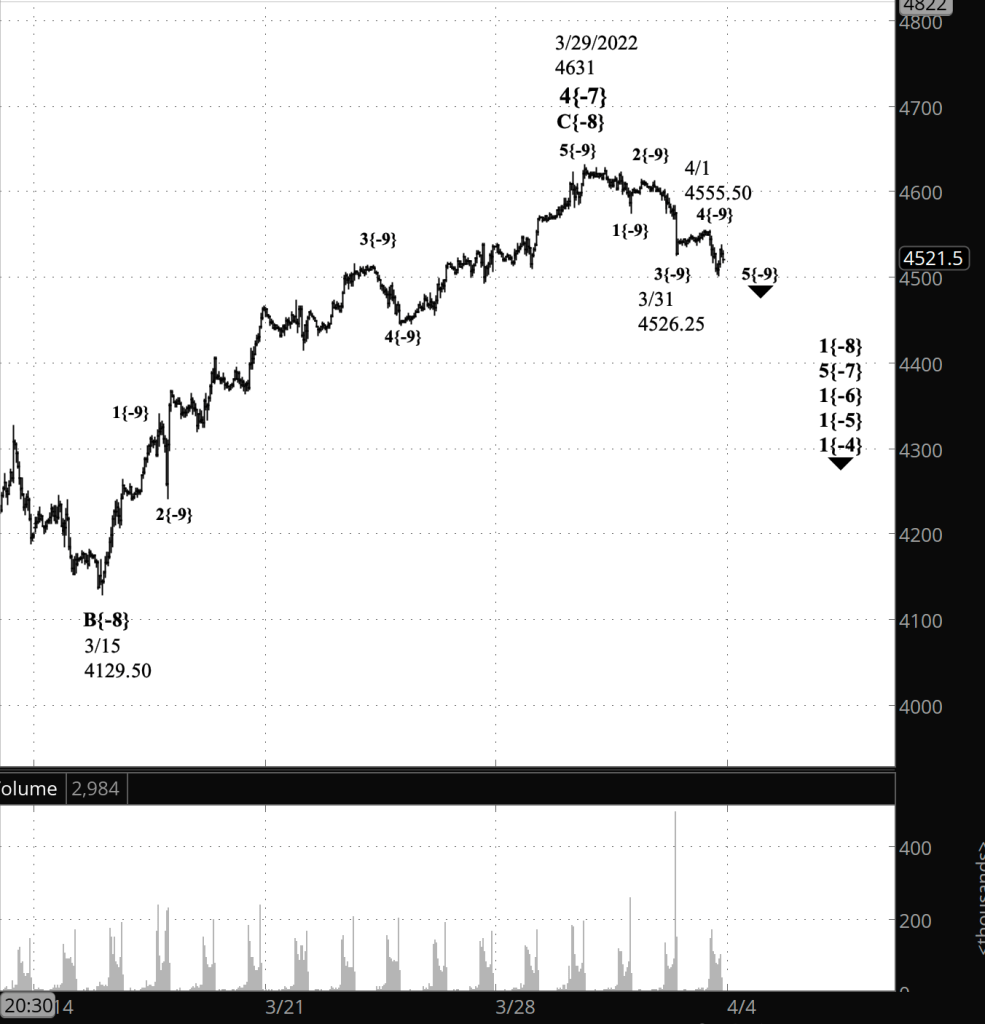
What does Elliott wave theory say? Today’s analysis counts the March 31 peak, 4631, as the end of upward wave 4{-7}, which began on February 24 from 4101.75. The decline that followed is wave 1{-8} within wave 5{-7}, both downtrending as a resumption of the decline that began on January 4 from 4808.25.
Alternative analysis #1, which was Thursday’s principal analysis, has wave C{-8} within wave 4{-7} still underway, with the decline that began on March 31 being a correction within C{-8}.
The price so far has reached 105 points below the March 31 peak, which seems overly large for a correction within wave C{-8}. Also, as the labels for the {-9} degree show, wave C{-8} has completed five clear waves, as is required of the final wave of a Flat correction, strengthening the conclusion that wave 4{-7} is complete.
Alternative analysis #2 sees the decline from March 31 as a connecting wave, X{-8}, within an ongoing wave 4{-7} upward correction. An X wave is followed by a second corrective pattern, and sometimes three such patterns are linked together in a compound correction.
An X wave can be of any corrective pattern internally. However, the form is usually a Zigzag of three waves. Within a Zigzag, the A wave is built from five waves; the B wave, three; and the C wave, five (5-3-5).
Internally, the decline that began on March 31 has completed three waves, with wave 3{-9} being the longest. the subsequent sideways movement, wave 4{-9}, is consistent with a five-wave pattern, and so could very well be part of a wave X{-8} within wave 4{-7}. At this point the requirements of wave 1{-8} and wave X{-8} are identical. However, reversals at the end of a correction (principal analysis) and corrections within a correction (alternative #1) are far more common than compound corrections (alternative #2), so I’ve treated the X-wave possibility as the least likely scenario.
We Are Here.
These are the waves currently in progress under my principal analysis. Each line on the list shows the wave number, with the subscript in curly brackets, the traditional degree name, the starting date, the starting price of the S&P 500 E-mini futures, and the direction of the wave.
- Index:
- 5{0} Intermediate, 12/26/2018, 2346.58 (up)
- 4{-1} Minor, 1/4/2022 4818.62 (down)
- 1{-2} Minute, 1/4/2022 4818.62 (down)
- Futures and index:
- 1{-3} Minuette, 1/4/2022, 4808.25 (down) (futures), 4818.62 (down) (index)
- Futures:
- 1{-4} Subminuette, 1/4/2022, 4808.25 (down)
- 1{-5} Micro, 1/4/2022, 4808.25 (down)
- 1{-6} Submicro, 1/4/2022, 4808.25 (down)
- 5{-7} Minuscule, 3/31/2022, 4631 (down)
- 1{-8} Subminuscule, 3/31/2022, 4631 (down)
Learning and other resources. Elliott wave analysis provides context, not prophecy. As the 20th century semanticist Alfred Korzybski put it in his book Science and Sanity (1933), “The map is not the territory … The only usefulness of a map depends on similarity of structure between the empirical world and the map.” And I would add, in the ever-changing markets, we can judge that similarity of structure only after the fact.
See the menu page Analytical Methods for a rundown on where to go for information on Elliott wave analysis.
By Tim Bovee, Portland, Oregon, April 1, 2022
Disclaimer
Tim Bovee, Private Trader tracks the analysis and trades of a private trader for his own accounts. Nothing in this blog constitutes a recommendation to buy or sell stocks, options or any other financial instrument. The only purpose of this blog is to provide education and entertainment.
No trader is ever 100 percent successful in his or her trades. Trading in the stock and option markets is risky and uncertain. Each trader must make trading decisions for his or her own account, and take responsibility for the consequences.
License
All content on Tim Bovee, Private Trader by Timothy K. Bovee is licensed under a Creative Commons Attribution-ShareAlike 4.0 International License.
Based on a work at www.timbovee.com.

You must be logged in to post a comment.