3:30 p.m. New York time
Half an hour before the closing bell. The S&P 500 E-mini futures continued to rise during the session, so far retracing more than 50% of the decline that began on March 29. An upward correction, wave 2{-8}, is now underway, and it is in its first subwave, A{-9}. The present rise will be followed by wave B{-9}, which will carry the price down toward the starting point of the correction, 4101.25, and then by wave C{-9}, which will carry the price up again.
I’ve updated the chart, bringing it closer to better see the progress of wave 2{-8} in relation to wave 1{-8} and have superimposed a Fibonacci retracement ladder. No change in the analysis.
9:35 a.m. New York time
What’s happening now? The S&P 500 E-mini futures continued their gentle rise after trading resumed overnight.
What does it mean? The downtrend that began on March 29 has completed an initial decline, lasting three days, and has begun an upward correction.
What is the alternative? It’s possible that the correction is of a smaller degree than I have marked on the chart. If that turns to be the case, then the initial decline is still underway and will be followed by a potentially larger correction to the upside.
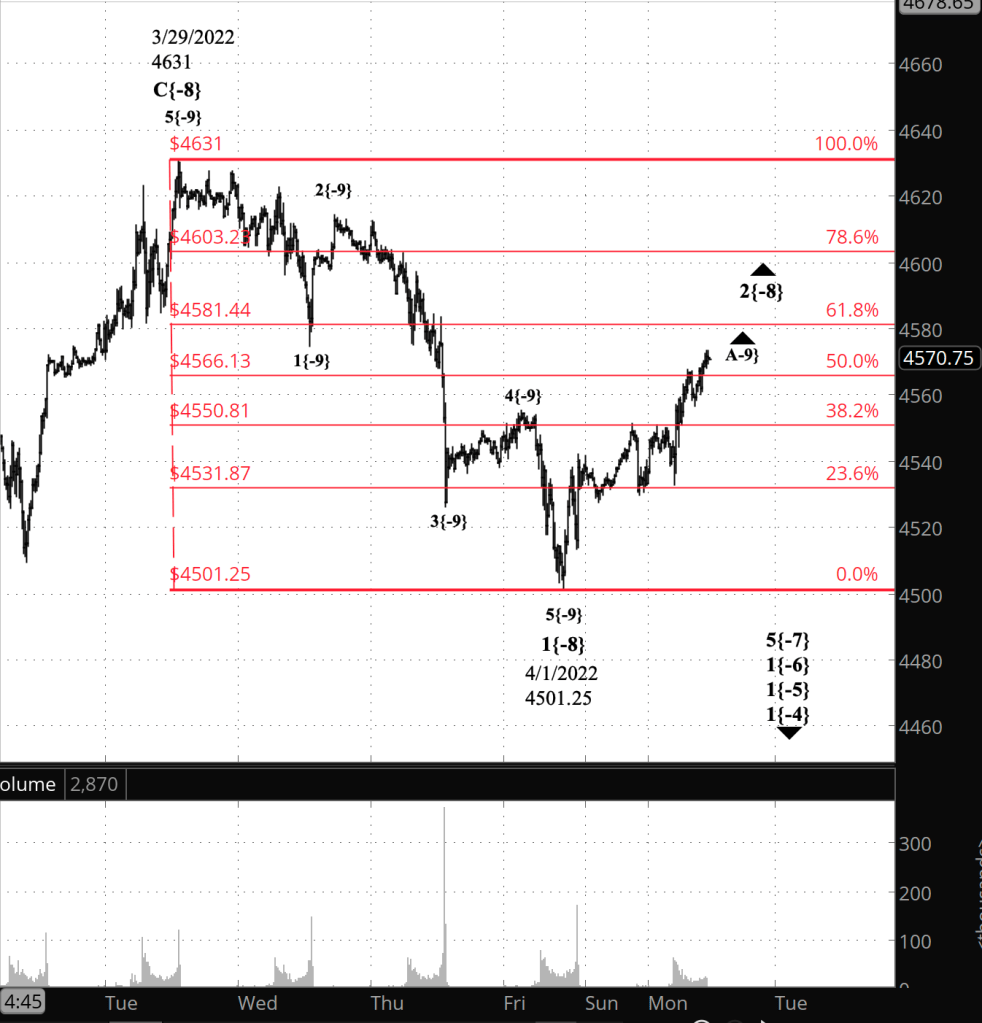
What does Elliott wave theory say? The downtrend that began on March 29 from 4631 and ended on April 1 at 4301.25 is upward wave 2{-8} within downtrending wave 1{-7}. A 2nd wave can either be a Zigzag or a Flat. They often retrace a great deal of the preceding 1st wave. What we see on the chart now is the tentative beginning of a larger movement. Internally, the first wave of the correction, wave A{-9}, is underway, and will have within it five or three wave: Five if its a Zigzag and three if its a Flat. Most 2nd wave that I’ve tracked have been Zigzags, but not all.
The alternative analysis is based on fact that makes analysis tricky early in a movement: The question of degree. Early on there’s very little context to guide the analysis, and so what I have labeled as wave 2{-8} within wave 1{-7} could in fact be could a smaller correction, wave 2{-9} within wave 5{-8}, for example, which would mean that the parent, declining wave 5{-8}, is still underway.
This duration of the wave can be a guide. This wave 1{-8} within a 5th wave has lasted for three days. The last time we had a wave 1{-8}, within a 1st wave at the start of the January 4 decline, it lasted for five days. So there’s a proportionality on the chart that led me to mark it as I did in my principal analysis. However, if the alternative scenario proves out then a 1st wave lasting five or seven days or so wouldn’t be out of line.
We Are Here.
These are the waves currently in progress under my principal analysis. Each line on the list shows the wave number, with the subscript in curly brackets, the traditional degree name, the starting date, the starting price of the S&P 500 E-mini futures, and the direction of the wave.
- Index:
- 5{0} Intermediate, 12/26/2018, 2346.58 (up)
- 4{-1} Minor, 1/4/2022 4818.62 (down)
- 1{-2} Minute, 1/4/2022 4818.62 (down)
- Futures and index:
- 1{-3} Minuette, 1/4/2022, 4808.25 (down) (futures), 4818.62 (down) (index)
- Futures:
- 1{-4} Subminuette, 1/4/2022, 4808.25 (down)
- 1{-5} Micro, 1/4/2022, 4808.25 (down)
- 1{-6} Submicro, 1/4/2022, 4808.25 (down)
- 5{-7} Minuscule, 3/31/2022, 4631 (down)
- 2{-8} Subminuscule, 4/1/2022, 4301.25 (up)
Learning and other resources. Elliott wave analysis provides context, not prophecy. As the 20th century semanticist Alfred Korzybski put it in his book Science and Sanity (1933), “The map is not the territory … The only usefulness of a map depends on similarity of structure between the empirical world and the map.” And I would add, in the ever-changing markets, we can judge that similarity of structure only after the fact.
See the menu page Analytical Methods for a rundown on where to go for information on Elliott wave analysis.
By Tim Bovee, Portland, Oregon, April 4, 2022
Disclaimer
Tim Bovee, Private Trader tracks the analysis and trades of a private trader for his own accounts. Nothing in this blog constitutes a recommendation to buy or sell stocks, options or any other financial instrument. The only purpose of this blog is to provide education and entertainment.
No trader is ever 100 percent successful in his or her trades. Trading in the stock and option markets is risky and uncertain. Each trader must make trading decisions for his or her own account, and take responsibility for the consequences.
License
All content on Tim Bovee, Private Trader by Timothy K. Bovee is licensed under a Creative Commons Attribution-ShareAlike 4.0 International License.
Based on a work at www.timbovee.com.

You must be logged in to post a comment.