3:30 p.m. New York time
Half hour before the closing bell. The S&P 500 futures whipsawed today, poking above the 61.8% Fibonacci retracement level in overnight trading, doing it again during the session, reaching a single point higher. It then reversed, scrambling down through the 50% and 38.2% Fibonacci levels before pausing at the 23.6% retracement level and then falling slightly below it. it was something of a roller-coaster ride.
Elliott wave analysis sees it this way: The declining middle wave of a three-wave upward correction, wave B{-9} within wave 2{-8}, is now underway and may be close to reaching its end as it approaches the beginning of the preceding A wave, 4501.25. It will be followed by a possible final wave, C{-9} to the upside, that will likely rise above today’s peak, 4579.25.
I say “possible” final wave because the correction could extend into a compound structure, adding a second corrective pattern and even a third. I haven’t seen many compound corrections in 2nd waves; they’re more common in 4th wave corrections. But we shall see if this 2nd wave is an outlier.
I’ve updated the chart.
12:55 p.m. New York time
Another analysis change. And having reached a new peak during the session, 4579.25, the S&P 500 futures price reversed sharply to the downside. The reversal re-instates this mornings initial principal analysis: Wave A{-9} has ended and wave B{-9} is underway, all within an upward correction, wave 4{-8}. I’ve updated the chart again.
11 a.m. New York time
Analysis change. The S&P 500 futures price has moved above the overnight high by a point. This promotes the alternative analysis to the prime analysis. Wave A{-9}, the middle leg of the upward correction, is still underway, as is its parent, wave 2{-8}. The rest of the analysis is unchanged. I’ve updated the chart.
9:35 a.m. New York time
What’s happening now? In overnight trading, the S&P 500 E-mini futures broke above a 60% retracement of the decline that began on March 29. It then quickly dove back to the 50% retracement level.
What does it mean? The overnight peak marked the end of the first portion of the upward correction that began on April 1, and the middle portion has begun. It will carry the price a distance down toward 4501.25, where the correction began. The final wave will return to the overnight high, 4587.25, and most likely rise above it.
What’s the alternative? The first portion of the correction could still be underway. The lower the price declines, the less likely this scenario is.
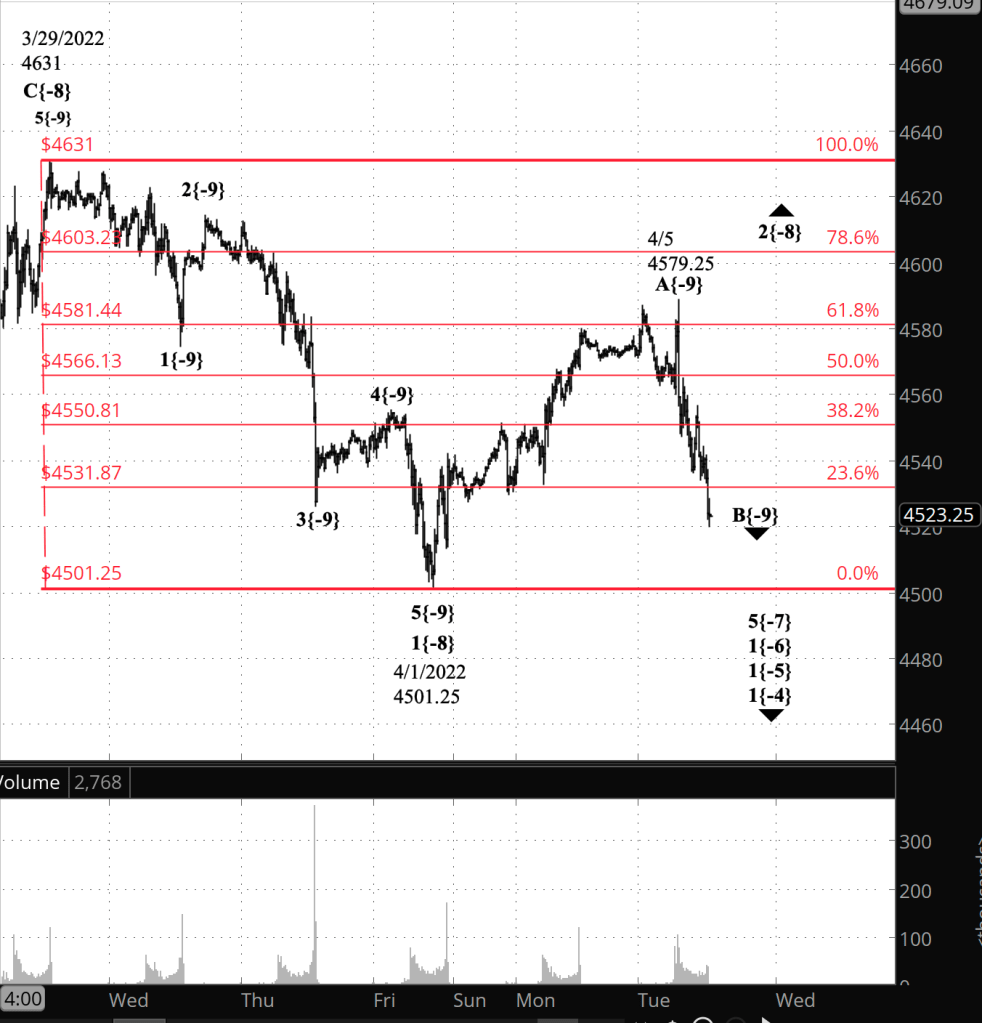
What does Elliott wave theory say? The upward correction is wave 2{-8} with within a larger downtrend, wave 1{-7}, which began on January 4. Within the correction, rising wave A{-9} was completed in overnight trading, and declining wave B{-9} has begun. A rising third wave, C{-9}, will complete the corrective pattern, and most likely, the parent wave, 2{-8}. The correction will be followed by a resumption of the downtrend, wave 3{-8}, which will carry the price below the end of the preceding 1st wave, 4501.25, perhaps significantly below that level.
We Are Here.
These are the waves currently in progress under my principal analysis. Each line on the list shows the wave number, with the subscript in curly brackets, the traditional degree name, the starting date, the starting price of the S&P 500 E-mini futures, and the direction of the wave.
- Index:
- 5{0} Intermediate, 12/26/2018, 2346.58 (up)
- 4{-1} Minor, 1/4/2022 4818.62 (down)
- 1{-2} Minute, 1/4/2022 4818.62 (down)
- Futures and index:
- 1{-3} Minuette, 1/4/2022, 4808.25 (down) (futures), 4818.62 (down) (index)
- Futures:
- 1{-4} Subminuette, 1/4/2022, 4808.25 (down)
- 1{-5} Micro, 1/4/2022, 4808.25 (down)
- 1{-6} Submicro, 1/4/2022, 4808.25 (down)
- 5{-7} Minuscule, 3/31/2022, 4631 (down)
- 2{-8} Subminuscule, 4/1/2022, 4501.25 (up)
Learning and other resources. Elliott wave analysis provides context, not prophecy. As the 20th century semanticist Alfred Korzybski put it in his book Science and Sanity (1933), “The map is not the territory … The only usefulness of a map depends on similarity of structure between the empirical world and the map.” And I would add, in the ever-changing markets, we can judge that similarity of structure only after the fact.
See the menu page Analytical Methods for a rundown on where to go for information on Elliott wave analysis.
By Tim Bovee, Portland, Oregon, April 5, 2022
Disclaimer
Tim Bovee, Private Trader tracks the analysis and trades of a private trader for his own accounts. Nothing in this blog constitutes a recommendation to buy or sell stocks, options or any other financial instrument. The only purpose of this blog is to provide education and entertainment.
No trader is ever 100 percent successful in his or her trades. Trading in the stock and option markets is risky and uncertain. Each trader must make trading decisions for his or her own account, and take responsibility for the consequences.
License
All content on Tim Bovee, Private Trader by Timothy K. Bovee is licensed under a Creative Commons Attribution-ShareAlike 4.0 International License.
Based on a work at www.timbovee.com.

You must be logged in to post a comment.