3:30 p.m. New York time
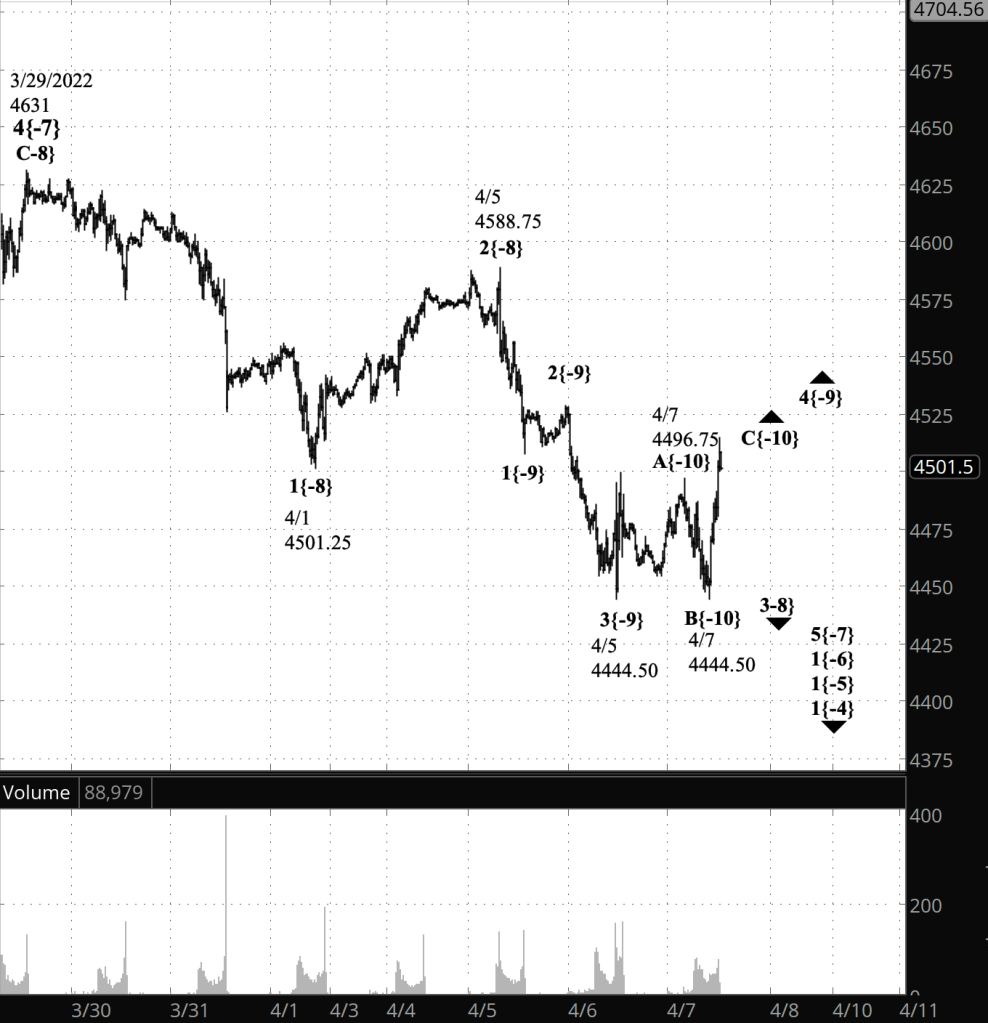
Half an hour before the closing bell. Once again the alternative analysis wins out. The price of the S&P 500 futures dropped to the level where the upward correction, wave 4{-9} began, but it didn’t below the level. Instead, it reversed and went above the high set in overnight trading, 4496.75.
Under the now discredited principal analysis, that would mean wave 4 went beyond the beginning of wave 1. That’s not allowed by a rule of Elliott wave analysis. Moving beyond that point isn’t a problem if its a C wave within a correction.
What it means in this: Wave 4{-9} is still underway, the 4496.75 high attained overnight is the end of wave A{-10} within the correction, the declined that followed was wave B{-10}, and the rise that is still underway is wave C{-10}.
Bottom line: The upward correction, wave 4{-9}, is still underway. The end of wave C{-10} will either be the end of wave 4{-9} and the beginning of a resumption of the downtrend, wave 5{-9}, or it will be followed by a connecting decline, wave X{-10}, which will be followed by a second corrective pattern within wave 4{-9}. I’ve retained this morning’s chart below and have added a new chart.
9:35 a.m. New York time
What’s happening now? The S&P 500 E-mini futures rose in overnight trading to 4496.75 and then reversed.
What does it mean? The overnight high completed an upward correction within a larger downtrend, which has resumed and will carry the price below the starting point of the correction, 4444.50 on April 5, and perhaps below the February 24 low of 4101.25.
What’s the alternative? The overnight high could be part of a subwave within the correction, which, under this scenario, would still be underway.
Note from later. This chart shows the morning’s principal analysis, which was disproven by the market movement during the session. For a new chart, based on this morning’s alternative analysis and this afternoon’s chart reality, see the “Half an hour before the closing bell” section above.
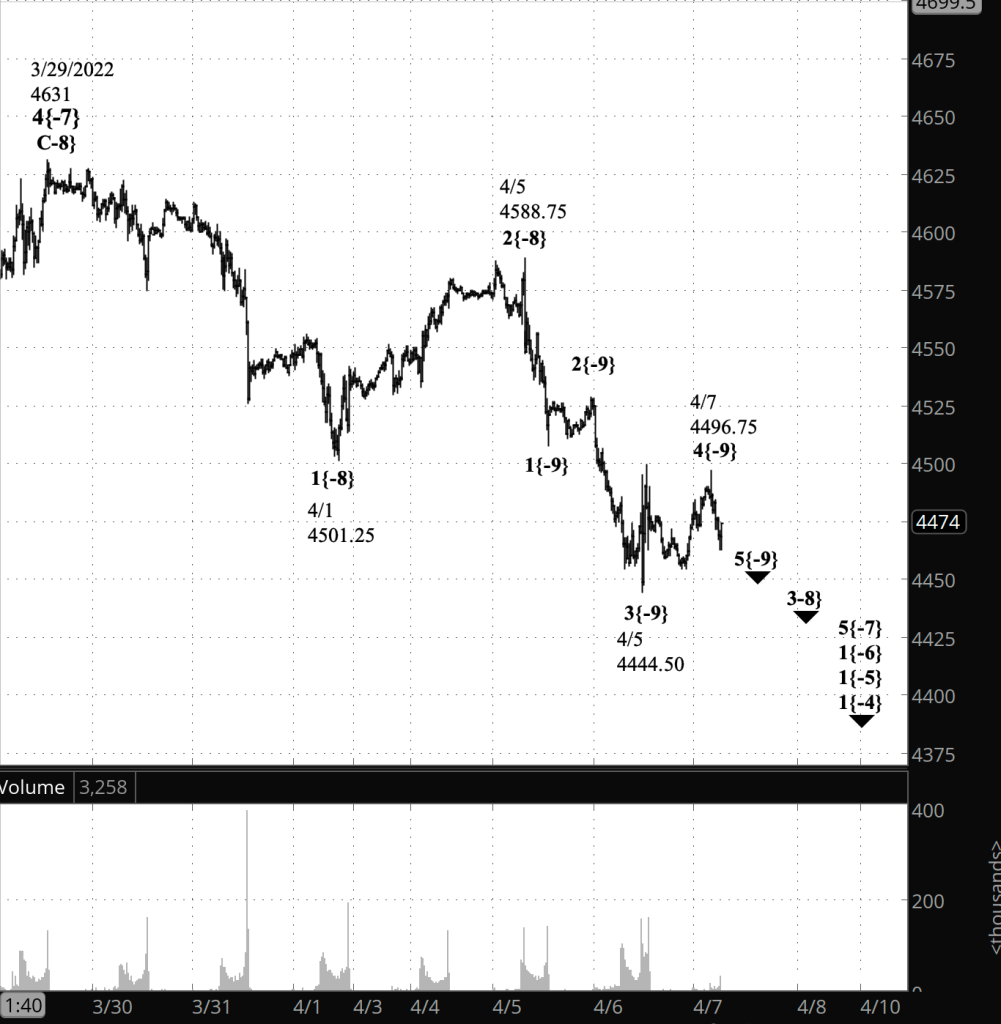
What does Elliott wave theory say? Under the principal analysis, wave 5{-9} within wave 3{-8} began from the overnight peak, 4496.50, and will carry the price below the start of the correction, wave 4{-9}, and perhaps below the end of wave 3{-7}, at 4101.75.
Under the alternative analysis, the upward correction, wave 4{-9} is still underway, and the overnight peak is part of wave C{-10} within the correction. Under this scenario wave C{-10} will likely remain above the the beginning of wave 4{-9}, at 4444.50, and will rise again, surpassing the overnight high, 4496.50.
Under both analyses, all of this is happening within downtrending wave 5{-7}, which began on March 31 from 4631.
We Are Here.
These are the waves currently in progress under my principal analysis. Each line on the list shows the wave number, with the subscript in curly brackets, the traditional degree name, the starting date, the starting price of the S&P 500 E-mini futures, and the direction of the wave.
- Index:
- 5{0} Intermediate, 12/26/2018, 2346.58 (up)
- 4{-1} Minor, 1/4/2022 4818.62 (down)
- 1{-2} Minute, 1/4/2022 4818.62 (down)
- Futures and index:
- 1{-3} Minuette, 1/4/2022, 4808.25 (down) (futures), 4818.62 (down) (index)
- Futures:
- 1{-4} Subminuette, 1/4/2022, 4808.25 (down)
- 1{-5} Micro, 1/4/2022, 4808.25 (down)
- 1{-6} Submicro, 1/4/2022, 4808.25 (down)
- 5{-7} Minuscule, 3/31/2022, 4631 (down)
- 3{-8} Subminuscule, 4/5/2022, 4588.75 (down)
Learning and other resources. Elliott wave analysis provides context, not prophecy. As the 20th century semanticist Alfred Korzybski put it in his book Science and Sanity (1933), “The map is not the territory … The only usefulness of a map depends on similarity of structure between the empirical world and the map.” And I would add, in the ever-changing markets, we can judge that similarity of structure only after the fact.
See the menu page Analytical Methods for a rundown on where to go for information on Elliott wave analysis.
By Tim Bovee, Portland, Oregon, April 7, 2022
Disclaimer
Tim Bovee, Private Trader tracks the analysis and trades of a private trader for his own accounts. Nothing in this blog constitutes a recommendation to buy or sell stocks, options or any other financial instrument. The only purpose of this blog is to provide education and entertainment.
No trader is ever 100 percent successful in his or her trades. Trading in the stock and option markets is risky and uncertain. Each trader must make trading decisions for his or her own account, and take responsibility for the consequences.
License
All content on Tim Bovee, Private Trader by Timothy K. Bovee is licensed under a Creative Commons Attribution-ShareAlike 4.0 International License.
Based on a work at www.timbovee.com.

[…] figure out when a game — a wave — has truly ended. That was the problem encountered in yesterday’s analysis, and the problem persists […]
LikeLike