3:30 p.m. New York time
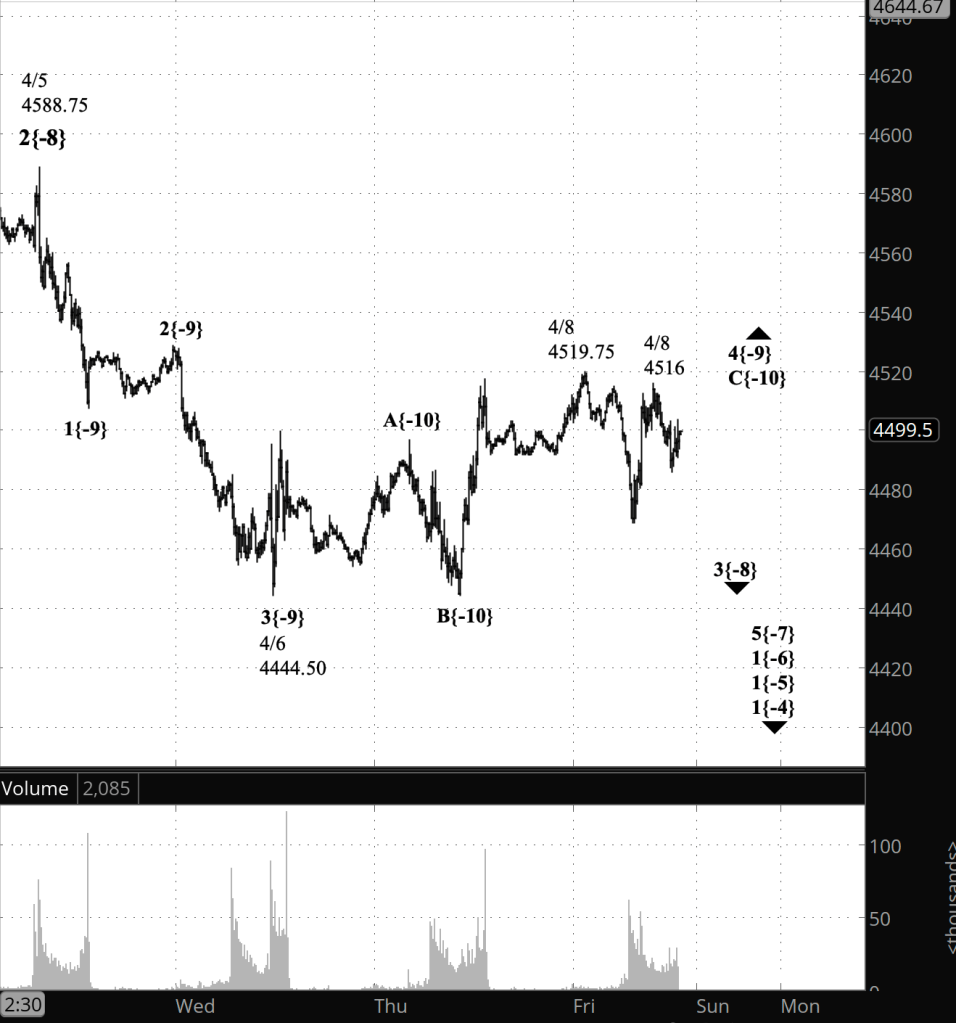
Half an hour before the closing bell. The S&P 500 rose into mid-session and then reversed at 4516, about 4 points short of the overnight high. It declined to 4486, and then reversed to the upside, half-heartedly. No change in the analysis. Wave C{-10} within the upward correction, wave 4{-9}, is still underway. I’ve updated the chart.
9:35 a.m. New York time
What’s happening now? The S&P 500 E-mini futures reached a high of 4519.75 in overnight trading and then reversed to the downside, falling by more than 25 points by the opening bell.
What does it mean? The upward correction that began on April 6 is still underway and the overnight reversal was but a stopping point in its continuing rise.
What’s the alternative? The upward correction ended with the overnight high, and the downtrend that began on April 5 has resumed. I consider the principal analysis and this alternative to be of equal likelihood at this point.
What does Elliott wave theory say? As the baseball great Yogi Berra said in 1973, “The game ain’t over until it’s over.” And the difficulty with Elliott wave analysis is that, unlike baseball, it’s impossible at times to figure out when a game — a wave — has truly ended. That was the problem encountered in yesterday’s analysis, and the problem persists today.
Under my principal analysis, the wave 4{-9} upward correction continues and the wave 5{-9} decline has not yet begun.
Or, alternatively, wave 4{-9} ended overnight at 4519.75 and wave 5{-9} has begun.
The question depends upon wave C{-10}, the final internal wave of the three-wave corrective pattern that began on April 6. Whether the pattern is a Zigzag or a Flat, the final wave C wave will have five waves internally. I count three waves. So despite the sharp drop, I consider wave C{-10} to not yet be over.
However, waves that are quick and short enough may not be visible at a certain level of granularity on the chart. Today’s chart has 10-minute bars, and those additional two waves may too small to see. On this chart, with 5-minute bars, there’s a slight downward slip in the final rise to the overnight high that could, with some imagination, be considered an internal wave that fills out the count. It doesn’t seem likely to me, but it’s not an impossible scenario.
If the price reverses and moves above 4519.75, then the principal analysis will be confirmed. The further the price falls, the more likely the alternative is, and a decline below 4444.50, the April 6 start of the correction, would confirm the alternative.
This is all happening within wave 3{-8} to the downside, which began on April 5 from 4588.75.
We Are Here.
These are the waves currently in progress under my principal analysis. Each line on the list shows the wave number, with the subscript in curly brackets, the traditional degree name, the starting date, the starting price of the S&P 500 E-mini futures, and the direction of the wave.
- Index:
- 5{0} Intermediate, 12/26/2018, 2346.58 (up)
- 4{-1} Minor, 1/4/2022 4818.62 (down)
- 1{-2} Minute, 1/4/2022 4818.62 (down)
- Futures and index:
- 1{-3} Minuette, 1/4/2022, 4808.25 (down) (futures), 4818.62 (down) (index)
- Futures:
- 1{-4} Subminuette, 1/4/2022, 4808.25 (down)
- 1{-5} Micro, 1/4/2022, 4808.25 (down)
- 1{-6} Submicro, 1/4/2022, 4808.25 (down)
- 5{-7} Minuscule, 3/31/2022, 4631 (down)
- 3{-8} Subminuscule, 4/5/2022, 4588.75 (down)
Learning and other resources. Elliott wave analysis provides context, not prophecy. As the 20th century semanticist Alfred Korzybski put it in his book Science and Sanity (1933), “The map is not the territory … The only usefulness of a map depends on similarity of structure between the empirical world and the map.” And I would add, in the ever-changing markets, we can judge that similarity of structure only after the fact.
See the menu page Analytical Methods for a rundown on where to go for information on Elliott wave analysis.
By Tim Bovee, Portland, Oregon, April 8, 2022
Disclaimer
Tim Bovee, Private Trader tracks the analysis and trades of a private trader for his own accounts. Nothing in this blog constitutes a recommendation to buy or sell stocks, options or any other financial instrument. The only purpose of this blog is to provide education and entertainment.
No trader is ever 100 percent successful in his or her trades. Trading in the stock and option markets is risky and uncertain. Each trader must make trading decisions for his or her own account, and take responsibility for the consequences.
License
All content on Tim Bovee, Private Trader by Timothy K. Bovee is licensed under a Creative Commons Attribution-ShareAlike 4.0 International License.
Based on a work at www.timbovee.com.

You must be logged in to post a comment.