3:30 p.m. New York time
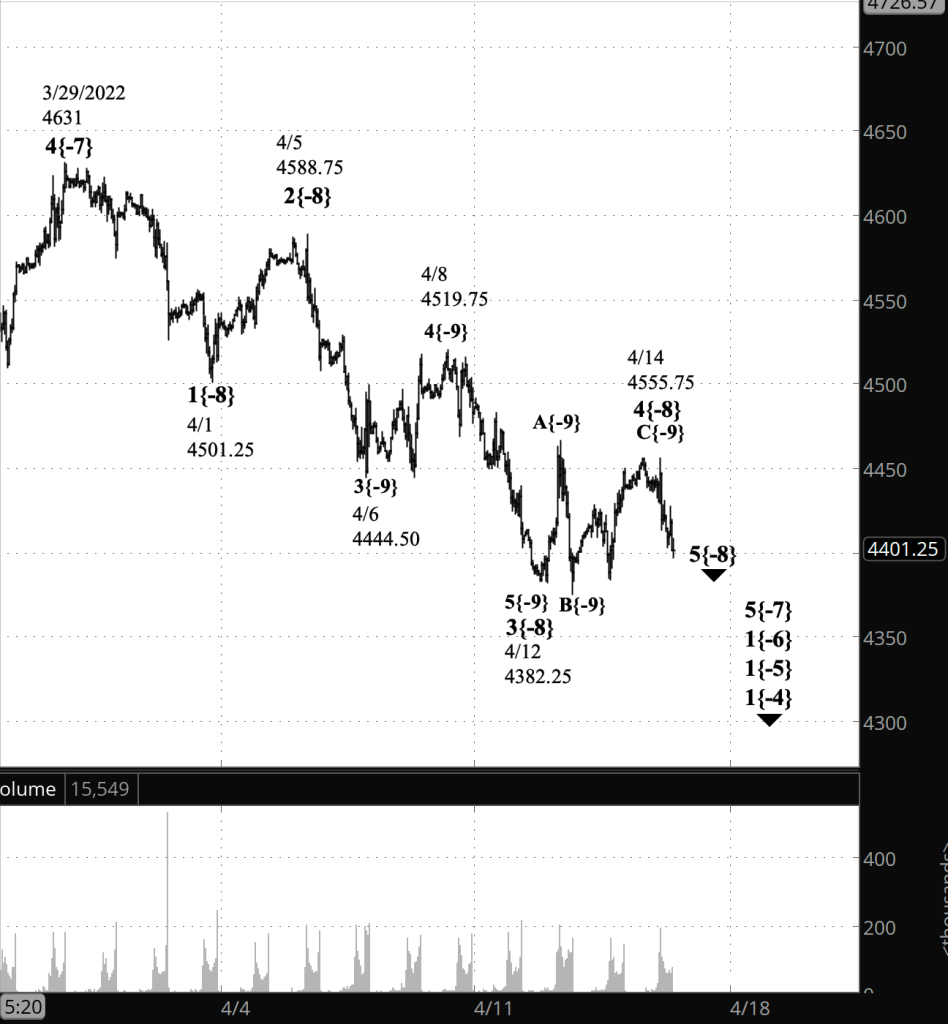
Half an hour before the closing bell. Under my principal analysis, the S&P 500 peaked at 4555.75 on the futures and reversed, resuming the downtrend that began on March 29. An alternative analysis, less common, is that the upward correction that began on April 12 is forming a compound structure, and the present decline is a wave connecting the completed corrective pattern with a second one.
Under the principal analysis, wave 4(-8} ended at the peak, and wave 5{-8} has begun. It will carry the price down to and likely beyond the end of the preceding 3rd wave, 4382.25, perhaps significantly beyond.
Under the alternative analysis, wave X{-9} within an ongoing wave 4{-8} is underway and most likely will remain above the end of the preceding 3rd wave, 4382.25.
2:05 p.m. New York time
SCHW earnings play entry. I’ve entered a short bear call vertical spread on SCHW, timed to catch the earnings announcement on Monday, April 18, a long holiday weekend after I made the trade. I’ve posted an analysis of the trade.
1:50 p.m. New York time
WFC earnings play exit. I’ve exited my short bear call options spread on WFC a day after entry for 54% of maximum potential profit and have updated the trade analysis with results.
9:35 a.m. New York time
What’s happening now? The S&P 500 E-mini futures rose to 4453.75 in overnight trading and then pulled back slightly.
What does it mean? The upward correction that began on April 12 continues and is in its third wave. I expect the decline from the overnight peak, a correction within that third wave , to quickly reverse and for the price to move above the overnight high in a final push to complete the parent wave.
What’s the alternative? I have no alternatives at present. The chart is exceptionally clear. That’s not to say that ambiguities won’t develop during the day.
Friday’s market closure. The U.S. stock exchanges will be closed on Friday for a holiday and will resume trading on Monday. If there should be any after-hours trading in the S&P 500 E-mini futures that impact the analysis, I’ll post a fresh analysis on Friday.
What does Elliott wave theory say? I read the overnight decline as wave 4{-10}, a correction within rising wave C{-9}, the third wave within the correction that began on April 12, wave 4{-8}. Wave C{-9} could be the end of the wave 4{-8} followed by a resumption of the downtrend, wave 5{-8}, or it could be followed by wave X{-9} to the downside, a wave connecting the corrective pattern just ended with a second corrective pattern in a compound structure.
We Are Here.
These are the waves currently in progress under my principal analysis. Each line on the list shows the wave number, with the subscript in curly brackets, the traditional degree name, the starting date, the starting price of the S&P 500 E-mini futures, and the direction of the wave.
- Index:
- 5{0} Intermediate, 12/26/2018, 2346.58 (up)
- 4{-1} Minor, 1/4/2022 4818.62 (down)
- 1{-2} Minute, 1/4/2022 4818.62 (down)
- Futures and index:
- 1{-3} Minuette, 1/4/2022, 4808.25 (down) (futures), 4818.62 (down) (index)
- Futures:
- 1{-4} Subminuette, 1/4/2022, 4808.25 (down)
- 1{-5} Micro, 1/4/2022, 4808.25 (down)
- 1{-6} Submicro, 1/4/2022, 4808.25 (down)
- 5{-7} Minuscule, 3/29/2022, 4631 (down)
- 5{-8} Subminuscule, 4/14/2022, 4555.75 (down)
Learning and other resources. Elliott wave analysis provides context, not prophecy. As the 20th century semanticist Alfred Korzybski put it in his book Science and Sanity (1933), “The map is not the territory … The only usefulness of a map depends on similarity of structure between the empirical world and the map.” And I would add, in the ever-changing markets, we can judge that similarity of structure only after the fact.
See the menu page Analytical Methods for a rundown on where to go for information on Elliott wave analysis.
By Tim Bovee, Portland, Oregon, April 14, 2022
Disclaimer
Tim Bovee, Private Trader tracks the analysis and trades of a private trader for his own accounts. Nothing in this blog constitutes a recommendation to buy or sell stocks, options or any other financial instrument. The only purpose of this blog is to provide education and entertainment.
No trader is ever 100 percent successful in his or her trades. Trading in the stock and option markets is risky and uncertain. Each trader must make trading decisions for his or her own account, and take responsibility for the consequences.
License
All content on Tim Bovee, Private Trader by Timothy K. Bovee is licensed under a Creative Commons Attribution-ShareAlike 4.0 International License.
Based on a work at www.timbovee.com.

[…] I have labeled as wave 3{-9} in this chart was labeled wave 5{-8} in Friday’s Trader’s Notebook. There is in Elliott a rule of proportionality: Waves of the same degree tend to be roughly the […]
LikeLike