3:30 p.m. New York time
Half an hour before the closing bell. The S&P 500 continued its decline throughout the day, reaching a low so far of 4355.50 on the futures. No change in the analysis. I’ve updated the chart.
11:25 a.m. New York time
JNJ earnings play entry. I’ve entered a short bull put options spread on JNJ in anticipation of the company’s earnings announcement Tuesday before the opening bell and have posted an analysis of the trade.
11 a.m. New York time
SCHW earnings play exit. I’ve exited my short bear call options spread on SCHW after earnings were published for 87.3% of maximum potential profit and have updated the trade analysis with results.
9:35 a.m. New York time
What’s happening now? The S&P 500 E-mini futures continued to fall after trading resumed Sunday evening.
What does it mean? The downtrend that began on January 4 from 4808.25 continues, as does the smaller downtrend that began on March 29 from 4631. The smaller downtrend, when complete, will be followed by an upward correction of a downtrend.
What’s the alternative? The available alternatives at this point have to do with how small the decline is in comparison to other movements in its environment. I’ve reduced the ups and downs since March 29 by one level. More on this in the Elliott wave theory section below.
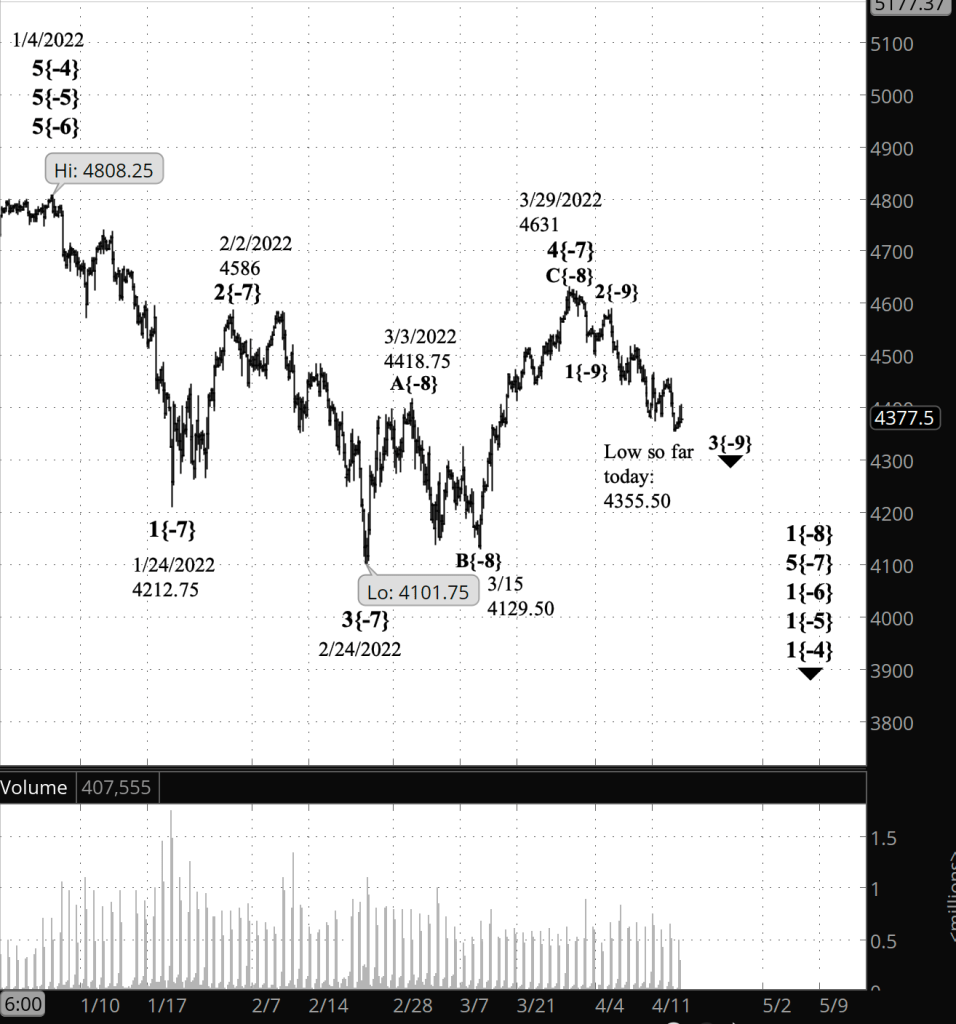
What does Elliott wave theory say? Under my principal analysis, wave 3{-9} within wave 1{-8} within wave 5{-7} is now underway.
I’ve often spoken of the ambiguity in assigning degrees to wave series, determining where they fit in the fractal structure of a trend, where each degree, constructed in the same manner as its parents and children, provides very little information to guide placement in the hierarchy wave wave structures.
What I have labeled as wave 3{-9} in this chart was labeled wave 5{-8} in Friday’s Trader’s Notebook. There is in Elliott a rule of proportionality: Waves of the same degree tend to be roughly the same in both magnitude — how much they rise and fall — and in duration — how long they last. By that standard, the {-8} degree waves within the downtrend that began March 29 are minuscule, and brief, compared to the stately {-8} waves within the upward correction that lasted from February 24 to March 29. And it’s possible that what I’ve labeled as the {-9} degree in this chart will turn out to be degree {-10}.
The demotion of the the former {-8} degree to {-9} makes the two wave sets more proportional to each other, and also brings clarity to the chart.
Wave 3{-9} will be followed by a small upward correction, wave 4{-9}, and then a resumption of the downtrend, wave 5{-9}. The end of wave 5{-9} will also end wave 1{-8}, which began on March 29 from 4631, along with its parent wave, downtrending 5{-7}.
Wave 1{-8} will be followed by a wave 2{-8} upward correction that, most likely, will take the form of a Zigzag. Here’s what we know about that futures wave 2{-8}: It will remain below 4631, because it is a firm rule in Elliott wave analysis that no 2nd wave moves beyond the beginning of the preceding 1st wave. As noted above, 2nd waves are usually Zigzag, although there are exceptions. Wave 2{-8} will have a three-wave corrective pattern internally, at the {-9} degree: Wave A to the upside, a downward wave B that likely will retrace between 38% and 79% of wave A, and finally a wave C that will rise higher than wave A did.
Once that corrective pattern has ended, most likely wave 3{-8} will follow, a resumption of the downtrend that will show great power, as 3rd waves do, carrying the price a significant distance lower.
Alternatively, wave C{-9} will be followed by a connecting wave, X{-9}, and then by a second corrective pattern. I’ve seen this more often in 4th wave, but it’s a possibility in 2nd waves as well.
We Are Here.
These are the waves currently in progress under my principal analysis. Each line on the list shows the wave number, with the subscript in curly brackets, the traditional degree name, the starting date, the starting price of the S&P 500 E-mini futures, and the direction of the wave.
- Index:
- 5{0} Intermediate, 12/26/2018, 2346.58 (up)
- 4{-1} Minor, 1/4/2022 4818.62 (down)
- 1{-2} Minute, 1/4/2022 4818.62 (down)
- Futures and index:
- 1{-3} Minuette, 1/4/2022, 4808.25 (down) (futures), 4818.62 (down) (index)
- Futures:
- 1{-4} Subminuette, 1/4/2022, 4808.25 (down)
- 1{-5} Micro, 1/4/2022, 4808.25 (down)
- 1{-6} Submicro, 1/4/2022, 4808.25 (down)
- 5{-7} Minuscule, 3/29/2022, 4631 (down)
- 1{-8} Subminuscule, 3/29/2022, 4631 (down)
- 3{-9} Bitsy, 4/5/2022, 4588.75 (down)
Learning and other resources. Elliott wave analysis provides context, not prophecy. As the 20th century semanticist Alfred Korzybski put it in his book Science and Sanity (1933), “The map is not the territory … The only usefulness of a map depends on similarity of structure between the empirical world and the map.” And I would add, in the ever-changing markets, we can judge that similarity of structure only after the fact.
See the menu page Analytical Methods for a rundown on where to go for information on Elliott wave analysis.
By Tim Bovee, Portland, Oregon, April 18, 2022
Disclaimer
Tim Bovee, Private Trader tracks the analysis and trades of a private trader for his own accounts. Nothing in this blog constitutes a recommendation to buy or sell stocks, options or any other financial instrument. The only purpose of this blog is to provide education and entertainment.
No trader is ever 100 percent successful in his or her trades. Trading in the stock and option markets is risky and uncertain. Each trader must make trading decisions for his or her own account, and take responsibility for the consequences.
License
All content on Tim Bovee, Private Trader by Timothy K. Bovee is licensed under a Creative Commons Attribution-ShareAlike 4.0 International License.
Based on a work at www.timbovee.com.

You must be logged in to post a comment.