3:30 p.m. New York time
Half an hour before the closing bell. The S&P 500 rose swiftly after the Federal Open Market Committee announced it was raising the Federal Funds rate by half a percent. An upward correction, wave 2{-10}, continues. It is a subwave within downtrending wave 3{-9}. No change in the analysis. I’ve updated the chart.
3 p.m. New York time
SBUX earnings play exit. I’ve exited my short bear call vertical spread on SBUX for 87.5% of maximum potential loss and have posted an update of the trade analysis with results.
2:45 p.m. New York time
AMD earnings play exit. I’ve exited my short bear call vertical spread on AMD for a 53.6% of maximum potential loss and have posted an update of the trade analysis with results.
9:35 a.m. New York time
What’s happening now? The S&P 500 E-mini futures climbed slightly in overnight trading but remained below Tuesday’s high, 4195.75
What does it mean? The upward correction that began on May 5 continues, a subwave within a larger downtrend that began on April 28.
What’s the alternative? The correction may be one degree larger than I’ve labeled it. Under this scenario, the April 28 downtrend ended on May 5 and the subsequent rise is an upward correction within a larger downtrend that began on April 21.
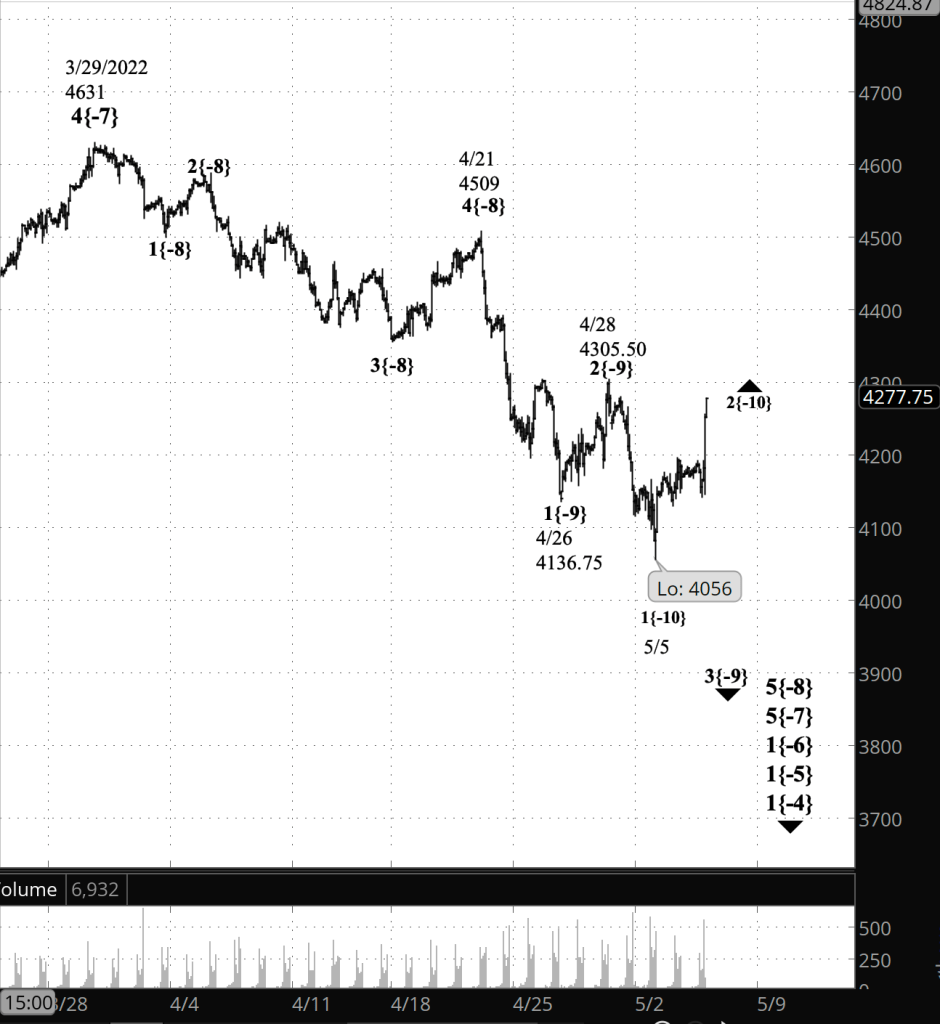
What does Elliott wave theory say? Under my principal analysis, the rise that began on May 5 is wave 2{-10}, an upward correction within wave 3{-9}, which began on April 28.
Under my alternative analysis, the rise from May 5 is wave 4{-9}, an upward correction. Its predecessor, wave 3{-9}, ended on May 5.
Both the principal and the alternative are happening within wave 5{-8}, which began on April 21.
We Are Here.
These are the waves currently in progress under my principal analysis. Each line on the list shows the wave number, with the subscript in curly brackets, the traditional degree name, the starting date, the starting price of the S&P 500 E-mini futures, and the direction of the wave.
- Index:
- 5{0} Intermediate, 12/26/2018, 2346.58 (up)
- 4{-1} Minor, 1/4/2022 4818.62 (down)
- 1{-2} Minute, 1/4/2022 4818.62 (down)
- Futures and index:
- 1{-3} Minuette, 1/4/2022, 4808.25 (down) (futures), 4818.62 (down) (index)
- Futures:
- 1{-4} Subminuette, 1/4/2022, 4808.25 (down)
- 1{-5} Micro, 1/4/2022, 4808.25 (down)
- 1{-6} Submicro, 1/4/2022, 4808.25 (down)
- 5{-7} Minuscule, 3/29/2022, 4631 (down)
- 5{-8} Subminuscule, 4/21/2022, 4509, (down)
Learning and other resources. Elliott wave analysis provides context, not prophecy. As the 20th century semanticist Alfred Korzybski put it in his book Science and Sanity (1933), “The map is not the territory … The only usefulness of a map depends on similarity of structure between the empirical world and the map.” And I would add, in the ever-changing markets, we can judge that similarity of structure only after the fact.
See the menu page Analytical Methods for a rundown on where to go for information on Elliott wave analysis.
By Tim Bovee, Portland, Oregon, May 5, 2022
Disclaimer
Tim Bovee, Private Trader tracks the analysis and trades of a private trader for his own accounts. Nothing in this blog constitutes a recommendation to buy or sell stocks, options or any other financial instrument. The only purpose of this blog is to provide education and entertainment.
No trader is ever 100 percent successful in his or her trades. Trading in the stock and option markets is risky and uncertain. Each trader must make trading decisions for his or her own account, and take responsibility for the consequences.
License
All content on Tim Bovee, Private Trader by Timothy K. Bovee is licensed under a Creative Commons Attribution-ShareAlike 4.0 International License.
Based on a work at www.timbovee.com.

You must be logged in to post a comment.