12:30 p.m. New York time
Half an hour before the closing bell. The S&P 500 declined sharply during the session, reaching below 4102, which is 201 points below Monday’s high of 4303. The price never exceeded Monday’s high, and so my principal analysis stands: Wave 2{-10}, an upward correction is underway and internally is in the second of three waves, Wave B{-11}. The B wave will be followed by a rising wave C{-11} that likely will reach above Monday’s high, which was the end of wave A{-11}. The rule I discussed this morning still stands. Wave 2{-10} and the C wave within must remain below 4305.50, the starting point of the preceding downtrending wave 1{-10}, which began on April 28. If it moves above that level, then the present wave count will be revised. I’ve updated the chart.
9:35 a.m. New York time
What’s happening now? The S&P 500 E-mini futures continued to rise in overnight trading, coming to within three points of the prior peak, 4305.50, attained on April 28.
What does it mean? The upward correction that began on May 2 continues.
What’s the alternative? Had the price moved above 4305.50, or if it does so today, then the present size designation of the upward correction would no longer match the chart and would require a reanalysis. For a detailed discussion, see the “Elliott wave theory” below.
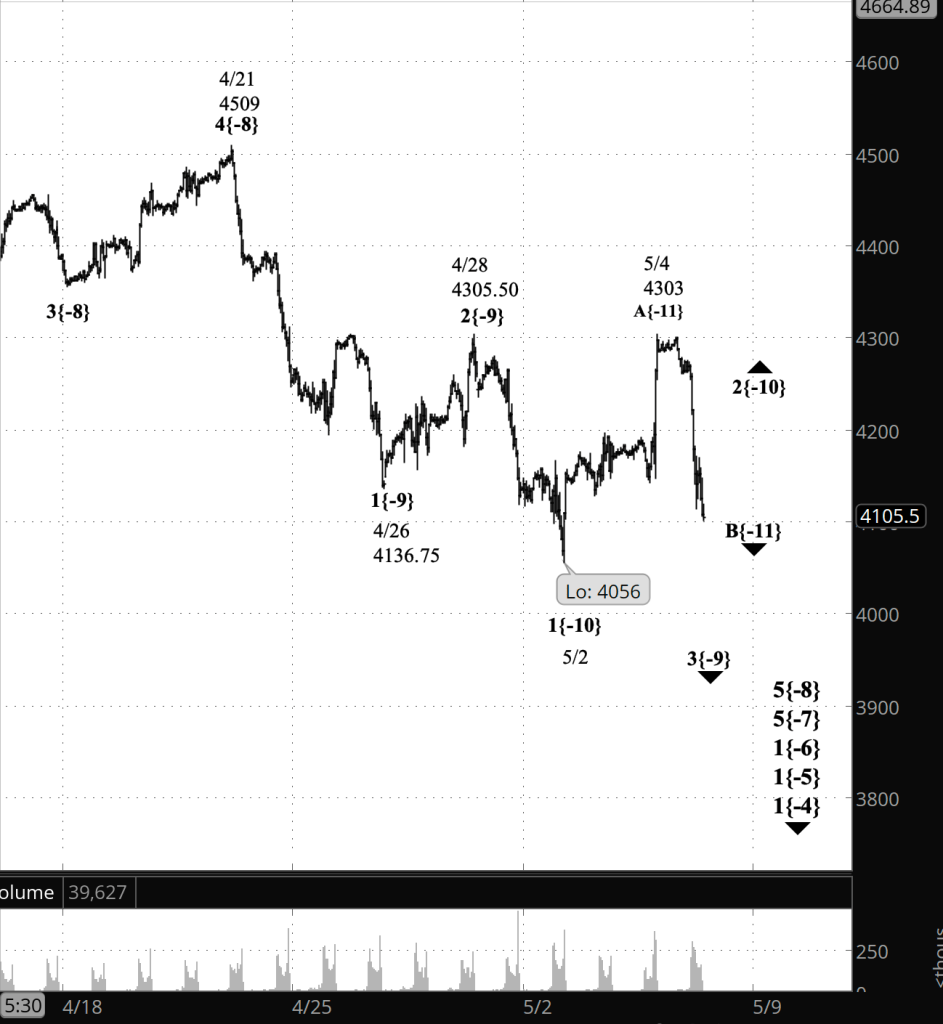
What does Elliott wave theory say? A larger downtrend, wave 5{-8}, began on April 21, and all that we’ve been tracking since has been within that wave. The question is, where do the subsequent wave fit in comparison with wave 5{-8}.
Under my principal analysis, I marked the chart as showing waves of increasingly smaller size. Wave 1{-9} within wave 5{-8} ended on April 26 and wave 2{-9} on April 28. But I labeled the next decline, beginning wave 3{-9}, as wave 1{-10}, the first subwave, which peaked at 4305.50. Under my analysis, the subsequent rise from 4056 on May 2 to 4303 on May 4 is wave 2{-10}, in the form of a subwave, A{-11}, which peaked at 4303.
And that’s a developing problem with the analysis. Second waves never move beyond the start of the preceding 1st wave. This 2nd wave, with its A wave, has come to within three points of that 1st wave starting point. Wave B can be expected to carry the price quite a distance downward. Wave C usually moves beyond the end of wave A. And the problem is, there’s not much space left for that move beyond — only 2-1/2 points. So it’s doable, but it’s inelegant.
If the price does break beyond 4305.50, then the analysis will no longer match the chart — the map will no longer match the territory — and so let’s look at a potential reanalysis.
The most likely, in my opinion, would take wave 1{-9}, which ended on May 2, and move it up a degree, relabeling it as the end of wave 1{-8}. The subsequent rise that ended on April 28, now labeled wave 2{-9}, would be wave A{-9} within wave 2{-8}. The decline that followed, ending on May 2, would be renumbered to B{-9} within 2{-8}. And the label on Wednesday’s rise would change from wave A{-11} to wave C{-9}, most likely the final subwave of the parent wave 2{-8}.
That’s the alternative analysis. In some ways it’s more elegant that the principal analysis. But elegance isn’t everything, and I’m not yet ready to promote this alternative to the top spot.
These are the waves currently in progress under my principal analysis. Each line on the list shows the wave number, with the subscript in curly brackets, the traditional degree name, the starting date, the starting price of the S&P 500 E-mini futures, and the direction of the wave.
We Are Here.
- Index:
- 5{0} Intermediate, 12/26/2018, 2346.58 (up)
- 4{-1} Minor, 1/4/2022 4818.62 (down)
- 1{-2} Minute, 1/4/2022 4818.62 (down)
- Futures and index:
- 1{-3} Minuette, 1/4/2022, 4808.25 (down) (futures), 4818.62 (down) (index)
- Futures:
- 1{-4} Subminuette, 1/4/2022, 4808.25 (down)
- 1{-5} Micro, 1/4/2022, 4808.25 (down)
- 1{-6} Submicro, 1/4/2022, 4808.25 (down)
- 5{-7} Minuscule, 3/29/2022, 4631 (down)
- 5{-8} Subminuscule, 4/21/2022, 4509, (down)
Learning and other resources. Elliott wave analysis provides context, not prophecy. As the 20th century semanticist Alfred Korzybski put it in his book Science and Sanity (1933), “The map is not the territory … The only usefulness of a map depends on similarity of structure between the empirical world and the map.” And I would add, in the ever-changing markets, we can judge that similarity of structure only after the fact.
See the menu page Analytical Methods for a rundown on where to go for information on Elliott wave analysis.
By Tim Bovee, Portland, Oregon, May 5, 2022
Disclaimer
Tim Bovee, Private Trader tracks the analysis and trades of a private trader for his own accounts. Nothing in this blog constitutes a recommendation to buy or sell stocks, options or any other financial instrument. The only purpose of this blog is to provide education and entertainment.
No trader is ever 100 percent successful in his or her trades. Trading in the stock and option markets is risky and uncertain. Each trader must make trading decisions for his or her own account, and take responsibility for the consequences.
License
All content on Tim Bovee, Private Trader by Timothy K. Bovee is licensed under a Creative Commons Attribution-ShareAlike 4.0 International License.
Based on a work at www.timbovee.com.

[…] I discussed the issue detail in the Elliott wave section of yesterday’s Trader’s Notebook. […]
LikeLike