3:30 p.m. New York time
Half an hour before the closing bell. The S&P 500 edged down further during the session, in line with this morning’s alternative analysis, and then rose again. So this afternoon’s analysis is much like this morning’s, with a new low, so far, of 3953 for the session. That places wave B{-11} at a 142% retracement of the preceding A wave. I’ve revised this morning’s target calculation to fix a procedural error and this afternoon’s targets remain the same: 4303 to 4463.50.
2:55 p.m. New York time
SPG earnings play exit. I’ve exited my short bull put spread on SPG for 25.1% of maximum potential profit and have updated the trade analysis with results.
9:35 a.m. New York time
What’s happening now? The S&P 500 E-mini futures declined to 3961.75 in overnight trading and the reversed to the upside.
What does it mean? Tentatively, my principal analysis is that the middle wave of the upward correction that began on May 2 ended at the overnight low, and the final wave in a three-wave Flat corrective pattern has begun and likely will push its way back into the 4200s or 4300s.
What’s the alternative? Or not. If the price reversed and moves below the overnight low, then the middle wave is still underway.
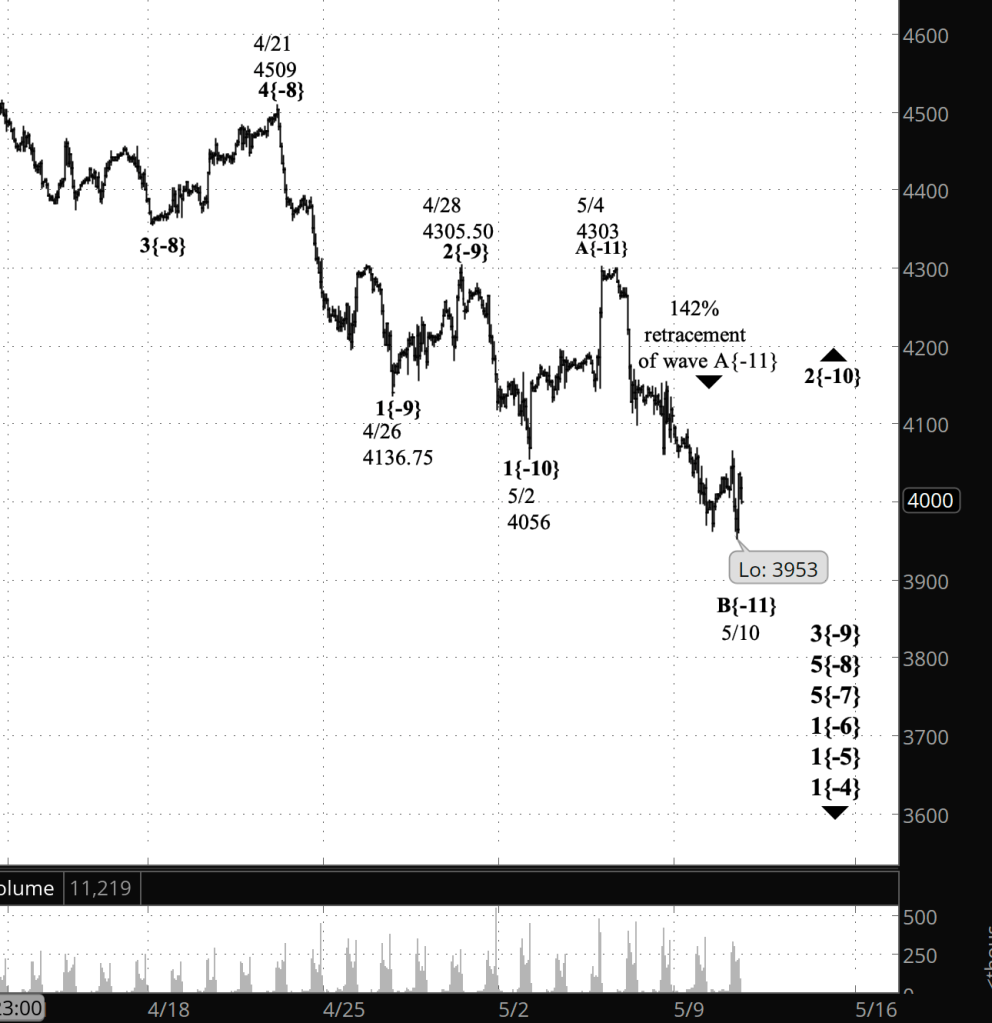
What does Elliott wave theory say? Wave B{-11} within wave 2{-10} — an upward correction within the wave 3{-9} downtrend — ended overnight, and wave C{-11} has begun. The B waves 138% retracement of the preceding A wave strongly suggests that wave {-10} is taking the form of a Flat. In a Flat, wave B usually retraces 100% to 138% of the preceding A wave, so if my principal analysis stands, the chart is showing a classic B-wave retracement. The C wave can be expected to retrace 100% to 165% of the A wave, which is 247 points long. So under that guideline (not a firm rule), we can expect wave C{-11} to rise by between 247 and 407.50 points, a target zone ranging from to 4303 to 4463.50, more or less. (The targets have been revised from today’s first posting of Trader’s Notebook to fix a procedural problem.)
A Flat pattern for a 2nd wave is somewhat unusual. Most often, wave 2 will be a Zigzag and wave 4 will be Flat. A Zigzag wave B cannot move above the starting point of the preceding A wave — 4303 in this case. If the parent wave 2 is indeed taking a Flat form, then no such restriction exists.
The primary evidence for the form of the correction will come from the internal wave counts. In a Flat, the counts are three waves for A, three for B and five for C (3-3-5). For a Zigzag, the internal counts are 5-3-5. In this case, wave A{-11} is a bit messy but can be counted as having three waves, and wave B is also a bit unclear, but can also be seen as having three waves. The main problem is that the upward middle waves within both A and B and quite small; they aren’t proportional to the size of their downward siblings.
I chose to count the overnight low as the end of wave B{-11}, but the price could very well reverse quickly and move lower. And so the alternative analysis is that wave B{-11} is still underway, and a lower ending point would also lower the target range for wave C{-11}. At this point I give equal odds to both the principal and the alternative analyses.
We Are Here.
These are the waves currently in progress under my principal analysis. Each line on the list shows the wave number, with the subscript in curly brackets, the traditional degree name, the starting date, the starting price of the S&P 500 E-mini futures, and the direction of the wave.
- Index:
- 5{0} Intermediate, 12/26/2018, 2346.58 (up)
- 4{-1} Minor, 1/4/2022 4818.62 (down)
- 1{-2} Minute, 1/4/2022 4818.62 (down)
- Futures and index:
- 1{-3} Minuette, 1/4/2022, 4808.25 (down) (futures), 4818.62 (down) (index)
- Futures:
- 1{-4} Subminuette, 1/4/2022, 4808.25 (down)
- 1{-5} Micro, 1/4/2022, 4808.25 (down)
- 1{-6} Submicro, 1/4/2022, 4808.25 (down)
- 5{-7} Minuscule, 3/29/2022, 4631 (down)
- 5{-8} Subminuscule, 4/21/2022, 4509, (down)
Learning and other resources. Elliott wave analysis provides context, not prophecy. As the 20th century semanticist Alfred Korzybski put it in his book Science and Sanity (1933), “The map is not the territory … The only usefulness of a map depends on similarity of structure between the empirical world and the map.” And I would add, in the ever-changing markets, we can judge that similarity of structure only after the fact.
See the menu page Analytical Methods for a rundown on where to go for information on Elliott wave analysis.
By Tim Bovee, Portland, Oregon, May 10, 2022
Disclaimer
Tim Bovee, Private Trader tracks the analysis and trades of a private trader for his own accounts. Nothing in this blog constitutes a recommendation to buy or sell stocks, options or any other financial instrument. The only purpose of this blog is to provide education and entertainment.
No trader is ever 100 percent successful in his or her trades. Trading in the stock and option markets is risky and uncertain. Each trader must make trading decisions for his or her own account, and take responsibility for the consequences.
License
All content on Tim Bovee, Private Trader by Timothy K. Bovee is licensed under a Creative Commons Attribution-ShareAlike 4.0 International License.
Based on a work at www.timbovee.com.

You must be logged in to post a comment.