3:30 p.m. New York time
Half an hour before the closing bell. The S&P 500 moved slightly lower during the trading session, to 3936.25. With the exception of that price, this morning’s principal analysis stands. I’ve updated the chart.
2:55 p.m. New York time
DIS earnings play entry. I’ve entered a short bull put vertical spread on DIS, using options that expire on June 17, and have posted an analysis of the trade.
9:35 a.m. New York time
What’s happening now? The S&P 500 E-mini futures traded in a narrow range overnight until the U.S. inflation report was released, when it fell sharply, within half an hour dipping below Tuesday’s low to 3947.25.
What does it mean? The declining middle segment of the upward correction that began on May 4 continues. When it is complete, the final segment of the corrective pattern will carry the price back up, most likely beyond the May 4 high of 4303.
What’s the alternative? The overnight low could mark the end of the middle segment and the start of the final wave of a three-wave corrective pattern.
If correction takes a simple form, then the end of the corrective pattern will also mark the end of the upward correction. However, corrections sometimes take compound forms, linking two or three corrective patterns together. As the New York Yankees baseball great Yogi Berra said, “It ain’t over ’til it’s over.”
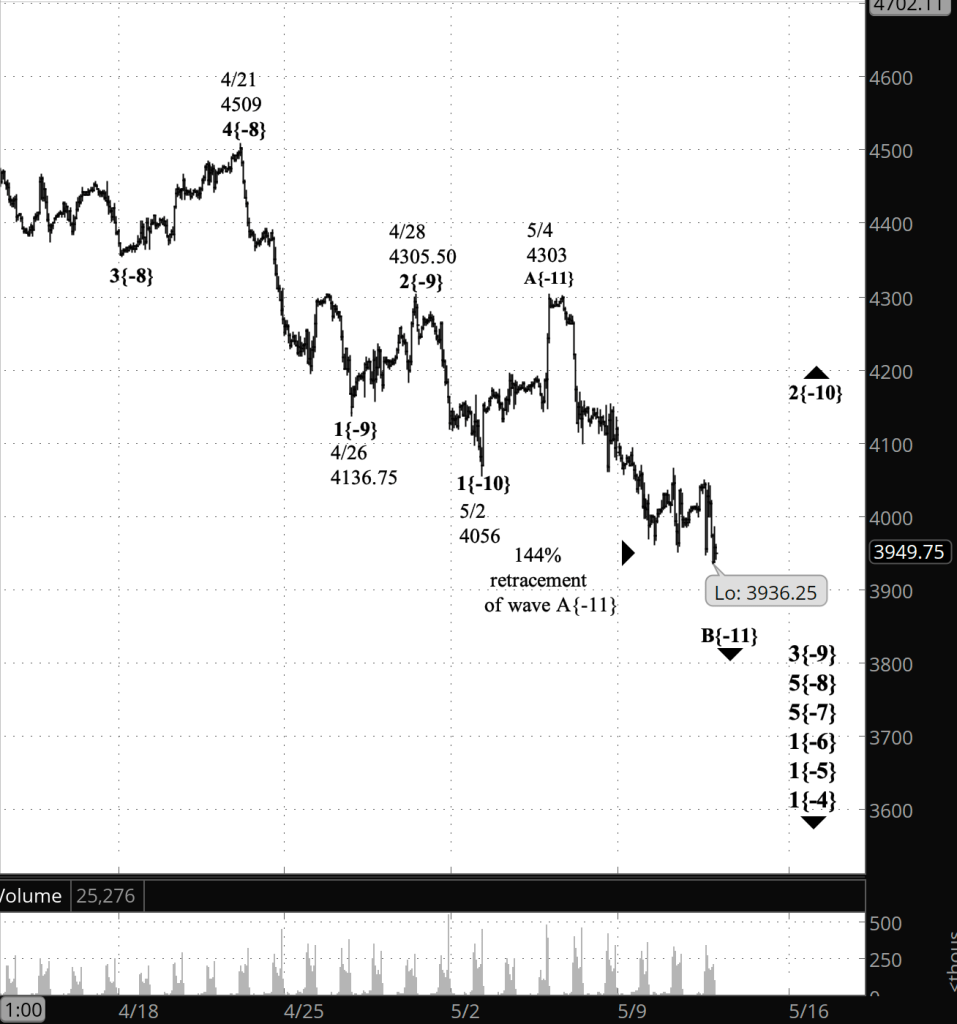
What does Elliott wave theory say? The principal analysis has basically been unchanged for a several days, but each day with a lower low. Wave B{-11} — the middle wave within the wave 2{-10} upward correction that began on May 2 — has so far retraced 144% of wave A{-11}. The rising C wave which will follow can be expected to retrace 100% to 165% of the preceding A wave, giving a target range of 4303 to 4463.50, more or less.
All of this is happening within a series of downtrends of larger degree: Wave 3{-9}, which began April 28, within wave 5{-8} from April 21, within wave 5{-7} from March 29, within wave 1{-6} from January 4, and five more steps further up the ladder of degrees to wave 4{-1}, which also began on January 4. The entire structure is part of wave 5{0}, an expanding Diagonal Triangle that began on December 26, 2018.
The first alternative analysis, similar to the past few days, would place the end of wave B{-11} and the beginning of wave C{-11} at the pre-session low of 3947.25.
The second alternative acknowledges the possibility of a compound correction, where wave C{-11}, instead of marking the end of its parent wave 2{-10}, is followed by a connecting wave, X{-11}, and then a second corrective pattern, extending wave 2{-10}.
We Are Here.
These are the waves currently in progress under my principal analysis. Each line on the list shows the wave number, with the subscript in curly brackets, the traditional degree name, the starting date, the starting price of the S&P 500 E-mini futures, and the direction of the wave.
- Index:
- 5{0} Intermediate, 12/26/2018, 2346.58 (up)
- 4{-1} Minor, 1/4/2022 4818.62 (down)
- 1{-2} Minute, 1/4/2022 4818.62 (down)
- Futures and index:
- 1{-3} Minuette, 1/4/2022, 4808.25 (down) (futures), 4818.62 (down) (index)
- Futures:
- 1{-4} Subminuette, 1/4/2022, 4808.25 (down)
- 1{-5} Micro, 1/4/2022, 4808.25 (down)
- 1{-6} Submicro, 1/4/2022, 4808.25 (down)
- 5{-7} Minuscule, 3/29/2022, 4631 (down)
- 5{-8} Subminuscule, 4/21/2022, 4509, (down)
Learning and other resources. Elliott wave analysis provides context, not prophecy. As the 20th century semanticist Alfred Korzybski put it in his book Science and Sanity (1933), “The map is not the territory … The only usefulness of a map depends on similarity of structure between the empirical world and the map.” And I would add, in the ever-changing markets, we can judge that similarity of structure only after the fact.
See the menu page Analytical Methods for a rundown on where to go for information on Elliott wave analysis.
By Tim Bovee, Portland, Oregon, May 11, 2022
Disclaimer
Tim Bovee, Private Trader tracks the analysis and trades of a private trader for his own accounts. Nothing in this blog constitutes a recommendation to buy or sell stocks, options or any other financial instrument. The only purpose of this blog is to provide education and entertainment.
No trader is ever 100 percent successful in his or her trades. Trading in the stock and option markets is risky and uncertain. Each trader must make trading decisions for his or her own account, and take responsibility for the consequences.
License
All content on Tim Bovee, Private Trader by Timothy K. Bovee is licensed under a Creative Commons Attribution-ShareAlike 4.0 International License.
Based on a work at www.timbovee.com.

[…] The upper chart above shows the new principal analysis. For a chart of the old analysis, see the May 11 Trader’s Notebook. […]
LikeLike