3:45 p.m. New York time
Correction. The price targets for Wave C{-10} in the Elliott Wave section were slightly off. I’ve corrected the calculation and the text, and have added red dashed lines to the chart that shows the likely range of the wave’s endpoint.
3:30 p.m. New York time
Half an hour before the closing bell. The S&P 500 moved slightly higher during the session, into the mid 3900s on the futures. No change in the analysis. I’ve updated the chart.
9:35 a.m. New York time
What’s happening now? The S&P 500 E-mini futures traded in a narrow range, in the low 3900s, after trading resumed overnight.
What does it mean? The upward correction that began on May 12 from 3855 is now in its third and likely final leg.
What are the alternatives? There are two:
Alternative #1: The second leg of the correction is still be underway. The price has reached the target price range and yet could have a bit more downside left.
Alternative #2: The upward correction ended on May 17, and the decline that followed is a resumption of the downtrend that began on April 21 from 4509.
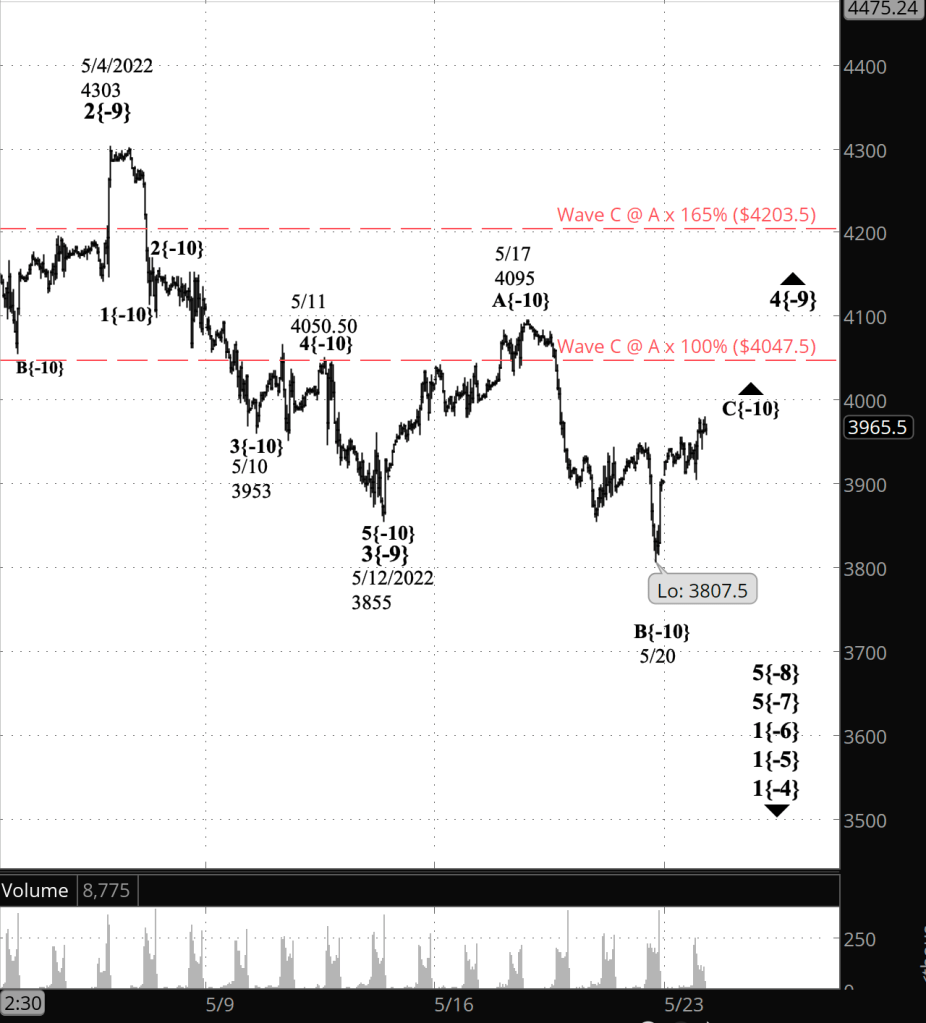
What does Elliott wave theory say? Under my principal analysis, wave 4{-9}, which began on May 12, is now in its third wave, C{-10}. In a Flat corrective pattern, the C wave is usually 100% to 165% as long as the preceding wave A. In this case, wave A{-10} was 240 points long, wave C that is 100% of that length would reach 4047.50, and at 165% of that length would reach 4203.50.
Wave C{-10} ends the corrective pattern, but sometimes corrections, especially 4th waves, will take a compound form, connecting two or three corrective patterns together within a single parent wave. The patterns are separated by connecting waves.
Under Alternative #1, wave B{-10} — the middle wave of its parent wave 4{-9} — is still underway. Friday’s low, 3807.25, was within the target price range, and the pattern can be counted as having three waves internally. Yet the rise and pause after that low could be subwaves of the third subwave within B{-10}.
Under Alternative #2, wave 4{-9} ended on May 17 at 4095. The internal wave structure is a bit muddy — trending waves and corrections seem shallower than they ought to be. Nonetheless, it can be counted as being a complete 4th wave correction.
We Are Here.
These are the waves currently in progress under my principal analysis. Each line on the list shows the wave number, with the subscript in curly brackets, the traditional degree name, the starting date, the starting price of the S&P 500 E-mini futures, and the direction of the wave.
- Index:
- 5{0} Intermediate, 12/26/2018, 2346.58 (up)
- 4{-1} Minor, 1/4/2022 4818.62 (down)
- 1{-2} Minute, 1/4/2022 4818.62 (down)
- Futures and index:
- 1{-3} Minuette, 1/4/2022, 4808.25 (down) (futures), 4818.62 (down) (index)
- Futures:
- 1{-4} Subminuette, 1/4/2022, 4808.25 (down)
- 1{-5} Micro, 1/4/2022, 4808.25 (down)
- 1{-6} Submicro, 1/4/2022, 4808.25 (down)
- 5{-7} Minuscule, 3/29/2022, 4631 (down)
- 5{-8} Subminuscule, 4/21/2022, 4509, (down)
Learning and other resources. Elliott wave analysis provides context, not prophecy. As the 20th century semanticist Alfred Korzybski put it in his book Science and Sanity (1933), “The map is not the territory … The only usefulness of a map depends on similarity of structure between the empirical world and the map.” And I would add, in the ever-changing markets, we can judge that similarity of structure only after the fact.
See the menu page Analytical Methods for a rundown on where to go for information on Elliott wave analysis.
By Tim Bovee, Portland, Oregon, May 23, 2022
Disclaimer
Tim Bovee, Private Trader tracks the analysis and trades of a private trader for his own accounts. Nothing in this blog constitutes a recommendation to buy or sell stocks, options or any other financial instrument. The only purpose of this blog is to provide education and entertainment.
No trader is ever 100 percent successful in his or her trades. Trading in the stock and option markets is risky and uncertain. Each trader must make trading decisions for his or her own account, and take responsibility for the consequences.
License
All content on Tim Bovee, Private Trader by Timothy K. Bovee is licensed under a Creative Commons Attribution-ShareAlike 4.0 International License.
Based on a work at www.timbovee.com.

You must be logged in to post a comment.