3:30 p.m. New York time
Half an hour before the closing bell. The final wave of the present upward corrective pattern in the S&P 500 continues. Wave C{-10} within wave 4{-9} will have five waves internally. The 1st wave is complete, a two-day drop from the 3900s in the futures into the 3800s was the 2nd wave, and a 3rd wave to upside may have begun, as the price returns to the 3900s. No change in the analysis. I’ve updated the upper chart.
9:35 a.m. New York time
What’s happening now? The S&P 500 E-mini futures continued to trade in the 3900s overnight, as it has since last Friday.
What does it mean? The upward correction that began May 12 continues, as does its third and likely final leg, which began on May 20.
What are the alternatives? Unchanged from yesterday.
Alternative #1: The second leg of the correction is still be underway. The price has reached the target price range and yet could have a bit more downside left.
Alternative #2: The upward correction ended on May 17, and the decline that followed is a resumption of the downtrend that began on April 21 from 4509.
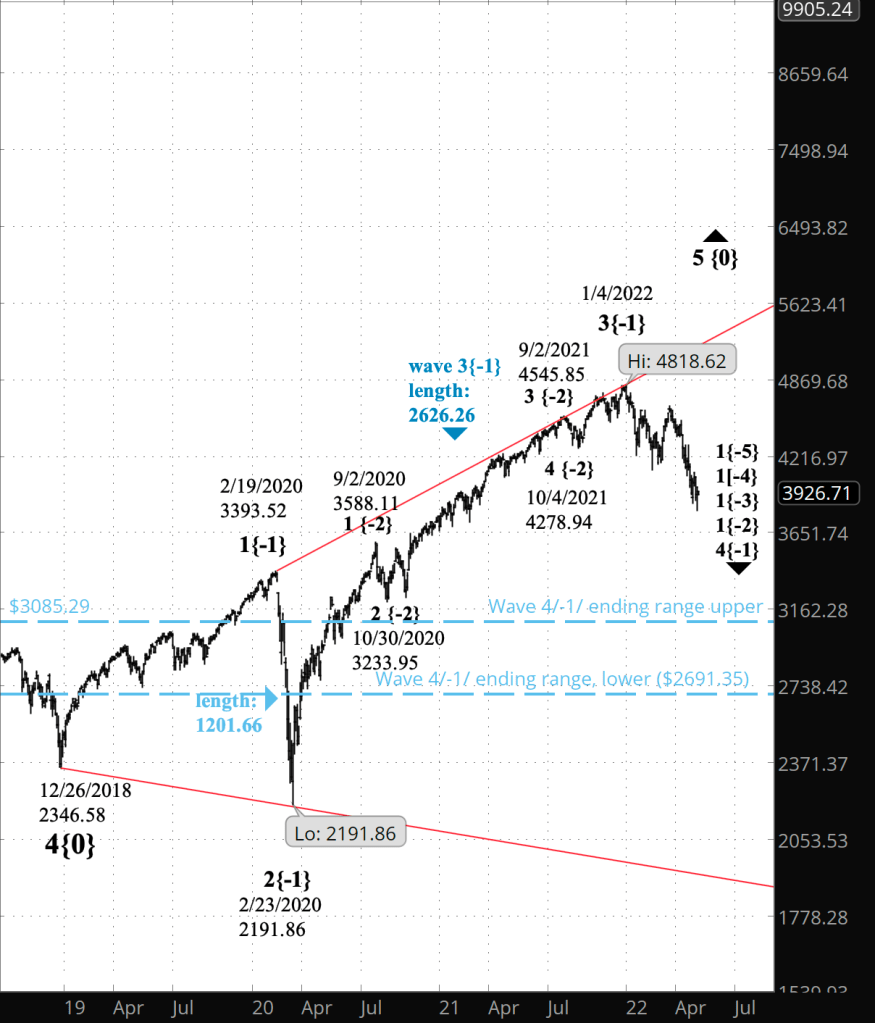
The Charts. The upper chart is a close-up view of the decline that began on May 4, covering 15 trading days. I’ll discuss it in the “What does Elliott wave theory say?” section. The lower chart covers the past three years and shows the present expanding Diagonal Triangle in its entirety. I’ll discuss it a section called “The Big Picture”, including setting some price targets for the decline that began on January 4.
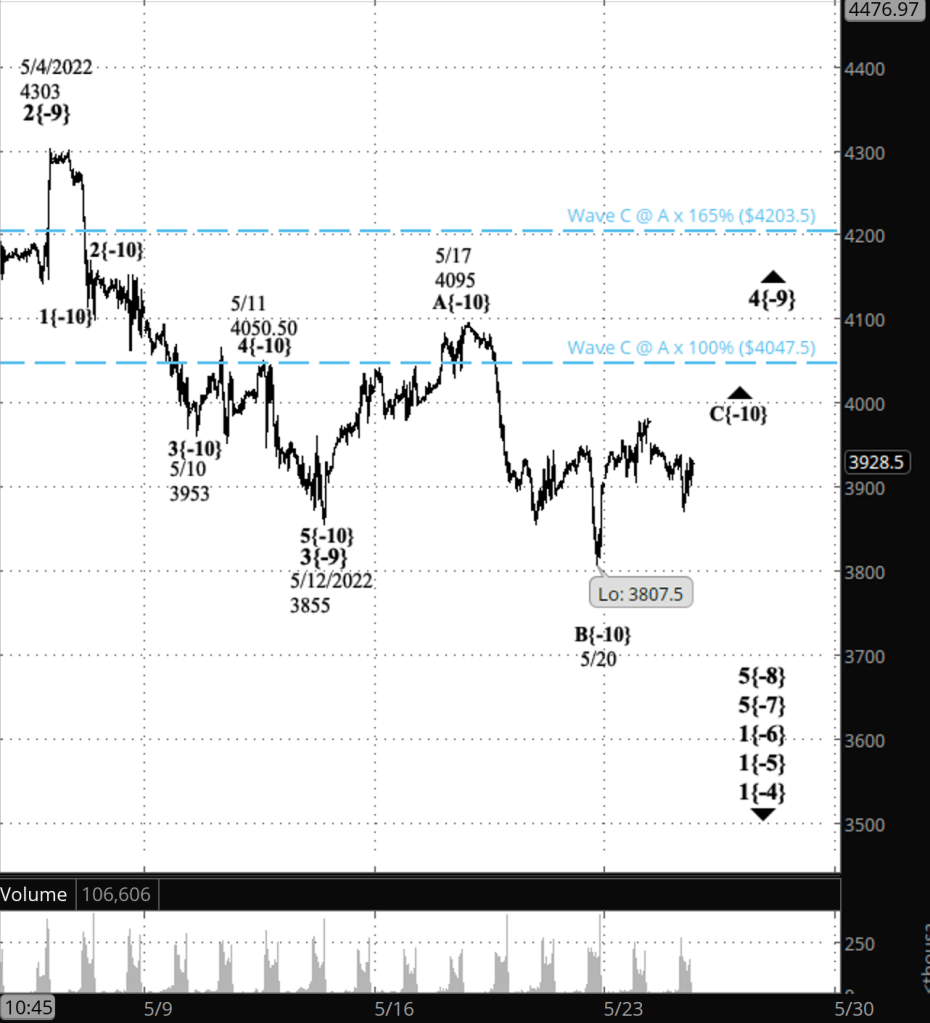
What does Elliott wave theory say? Under the principal analysis, the upward correction, wave 4{-9} is in what most likely will be its final wave, C{-10}. The correction is taking the form of a Flat, and C waves in Flats will often retrace 100% to 165% of the preceding A wave, giving a target price range of 4047.50 to 4203.50. I’ve marked those levels on the chart with blue dashed lines.
I say the C wave is likely the final wave because 4th wave corrections commonly have three waves internally. Sometimes, however, 4th waves will connect two or three corrective patterns patterns together. It’s less common, but not uncommon.
Under Alternative #1, wave B{-10} within wave 4{-9} is nearing an end but has not yet reached completion. It will be followed by a resumption of the downtrend, wave 5{-9}.
Under Alternative #2, the upward correction, wave 4{-9}, ended on May 17 after completing three waves, with an overly short B wave in the middle. The decline the followed is downtrending wave 5{-9}.
The principal and the alternatives are all playing out within downtrending wave 5{-8}, which began on April 21 from 4509.
The Big Picture. The lower chart shows a view of the S&P 500 index since the beginning, on December 26, 2018, of the expanding Diagonal Triangle that has encompassed all of the ups and downs of the markets for more than three years.
The Triangle is wave 5{0} within the wave 5{+1} uptrend that began on March 6, 2009, from 666.79. We’ve come a long way since that middle year of the Great Recession.
A Diagonal Triangle has five waves within it, and the present decline is wave 4{-1}. My question is, how low can it go?
Elliott wave theory provides answers. There are two rules governing the 4th wave of a Diagonal Triangle. It never moves beyond the end of the preceding 1st wave, and must end within the price range of that 1st wave.
Wave 4{-1} can’t move below 2346.58, where wave 1{-1} began, and it must decline to at least 3393.52, the endpoint of wave 1{-1}.
There are also some tendencies relating to 4th waves within Diagonal Triangles.
The 4th wave is usually longer than the preceding 2nd wave. Wave 2{-1} was 1,201.66 points long, wave 4{-1} began at 4818.62, and subtraction gives us a 4th wave endpoint of at least 3616.46, around 350 points below the present level.
The 4th usually retraces between 66% and 81% of the preceding 3rd wave. Wave 3{-1}, which ended at 4818.62, is 2,626.26 in length. So 66% of that length is 1,733.33 and 81% is 2,127.27. Those lengths, subtracted from the endpoint, provide a price range of 2691.35 to 3085.29.
Put all the rules and the tendencies together, and the endpoint of the present wave 4{-1} downtrend is likely to be between 2691.35 and 3085.29, more or less. I’ve marked that range on the chart with blue dotted lines.
However, a caveat. That range describes tendencies. Under the strict rules, wave 4{-1} could end as high as 3393.52 and as low as 2346.58 — each about 300 points beyond the nearest retracement wave the 3rd wave..
We Are Here.
These are the waves currently in progress under my principal analysis. Each line on the list shows the wave number, with the subscript in curly brackets, the traditional degree name, the starting date, the starting price of the S&P 500 E-mini futures, and the direction of the wave.
- S&P 500 Index:
- 5{+3} Supercycle, 7/8/1932, 4.4 (up)
- 5{+2} Cycle, 12/9/1974, 60.96 (up)
- 5{+1} Primary, 3/6/2009, 666.79 (up)
- 5{0} Intermediate, 12/26/2018, 2346.58 (up)
- 4{-1} Minor, 1/4/2022 4818.62 (down)
- 1{-2} Minute, 1/4/2022 4818.62 (down)
- S&P 500 Futures and index:
- 1{-3} Minuette, 1/4/2022, 4808.25 (down) (futures), 4818.62 (down) (index)
- S&P 500 Futures:
- 1{-4} Subminuette, 1/4/2022, 4808.25 (down)
- 1{-5} Micro, 1/4/2022, 4808.25 (down)
- 1{-6} Submicro, 1/4/2022, 4808.25 (down)
- 5{-7} Minuscule, 3/29/2022, 4631 (down)
- 5{-8} Subminuscule, 4/21/2022, 4509, (down)
Learning and other resources. Elliott wave analysis provides context, not prophecy. As the 20th century semanticist Alfred Korzybski put it in his book Science and Sanity (1933), “The map is not the territory … The only usefulness of a map depends on similarity of structure between the empirical world and the map.” And I would add, in the ever-changing markets, we can judge that similarity of structure only after the fact.
See the menu page Analytical Methods for a rundown on where to go for information on Elliott wave analysis.
By Tim Bovee, Portland, Oregon, May 24, 2022
Disclaimer
Tim Bovee, Private Trader tracks the analysis and trades of a private trader for his own accounts. Nothing in this blog constitutes a recommendation to buy or sell stocks, options or any other financial instrument. The only purpose of this blog is to provide education and entertainment.
No trader is ever 100 percent successful in his or her trades. Trading in the stock and option markets is risky and uncertain. Each trader must make trading decisions for his or her own account, and take responsibility for the consequences.
License
All content on Tim Bovee, Private Trader by Timothy K. Bovee is licensed under a Creative Commons Attribution-ShareAlike 4.0 International License.
Based on a work at www.timbovee.com.

[…] discussed in yesterday’s Trader’s Notebook, the various rules and tendencies of Elliott wave analysis allows analysts to infer a likely range […]
LikeLike