3:30 p.m. New York time
Half an hour before the closing bell. The S&P 500 rose during the session, reaching the 3990s on the futures. The higher it goes, the more likely it is that wave C{-10} within the wave 4{-9} upward correction is still underway. No change in the analysis. I’ve updated the chart.
2:50 p.m. New York time
OLLI earnings play entry. I’ve entered a short bear calls options spread on OLLI and have posted a trade analysis.
2:35 p.m. New York time
DLTR earnings play entry. I’ve entered a short bear call options spread on DLTR and have posted a trade analysis with details of the position’s structure and other details.
9:35 a.m. New York time
What’s happening now? The S&P 500 E-mini futures traded narrowly in the 3900s overnight.
What does it mean? The second of five segments within the final leg of an upward corrective pattern is now underway. When the corrective pattern is complete, it is most likely that the downtrend that began on April 21 from 4509 will resume. I’ve marked the probable ending range of the correction in blue on the chart.
What are the alternatives? There are two, and I consider both to be unlikely.
Alternative #1: The upward correction ended on May 17, and the downward correction has resumed. The severely truncated middle wave of the correction under this scenario makes the chart a poor fit for this analysis.
Alternative #2: The middle wave of the upward correction is still underway and the final wave has yet to begin. The longer the present sideways movement goes, without the price reaching down to the end point of the middle wave so far, the less likely this scenario appears.
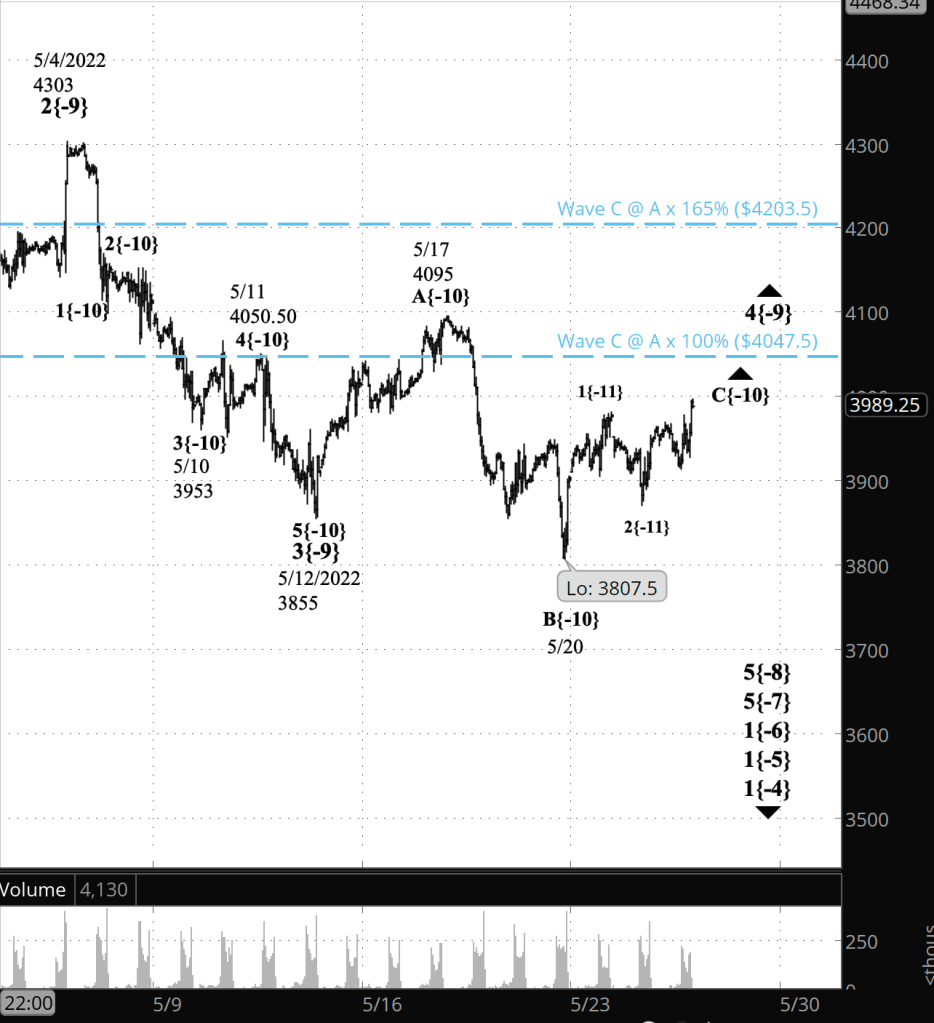
What does Elliott wave theory say? Under the principal analysis, wave C{-10} within wave 4{-9} — the final wave in an upward corrective pattern — is now underway. The C wave will have five waves within it, and presently wave 2{-11} of that set is now underway. The end of wave C will mark the end of the parent wave 4, if the 4th is a simple correction. Sometimes 4th waves will string together two or three corrective patterns, and if that occurs, then wave C{-10} will be followed by a connecting wave X{-10} and then wave A{-10}, the first wave of a second corrective pattern.
As discussed in yesterday’s Trader’s Notebook, the various rules and tendencies of Elliott wave analysis allows analysts to infer a likely range within which the C wave will end. In this case, wave C{-10} will likely end between 4047.50 and 4203.50. That’s a tendency, not a sure thing.
Under alternative #1, May 17 marked the end of wave 4{-9} and the subsequent decline is wave 5{-9}, which internally is now working through wave 2{-10}, an upward correction within the downtrend.
Under alternative #2, wave B{-10} within wave 4{-9} is not yet complete.
We Are Here.
These are the waves currently in progress under my principal analysis. Each line on the list shows the wave number, with the subscript in curly brackets, the traditional degree name, the starting date, the starting price of the S&P 500 E-mini futures, and the direction of the wave.
- S&P 500 Index:
- 5{+3} Supercycle, 7/8/1932, 4.40 (up)
- 5{+2} Cycle, 12/9/1974, 60.96 (up)
- 5{+1} Primary, 3/6/2009, 666.79 (up)
- 5{0} Intermediate, 12/26/2018, 2346.58 (up)
- 4{-1} Minor, 1/4/2022 4818.62 (down)
- 1{-2} Minute, 1/4/2022 4818.62 (down)
- S&P 500 Futures and index:
- 1{-3} Minuette, 1/4/2022, 4808.25 (down) (futures), 4818.62 (down) (index)
- S&P 500 Futures:
- 1{-4} Subminuette, 1/4/2022, 4808.25 (down)
- 1{-5} Micro, 1/4/2022, 4808.25 (down)
- 1{-6} Submicro, 1/4/2022, 4808.25 (down)
- 5{-7} Minuscule, 3/29/2022, 4631 (down)
- 5{-8} Subminuscule, 4/21/2022, 4509, (down)
Learning and other resources. Elliott wave analysis provides context, not prophecy. As the 20th century semanticist Alfred Korzybski put it in his book Science and Sanity (1933), “The map is not the territory … The only usefulness of a map depends on similarity of structure between the empirical world and the map.” And I would add, in the ever-changing markets, we can judge that similarity of structure only after the fact.
See the menu page Analytical Methods for a rundown on where to go for information on Elliott wave analysis.
By Tim Bovee, Portland, Oregon, May 25, 2022
Disclaimer
Tim Bovee, Private Trader tracks the analysis and trades of a private trader for his own accounts. Nothing in this blog constitutes a recommendation to buy or sell stocks, options or any other financial instrument. The only purpose of this blog is to provide education and entertainment.
No trader is ever 100 percent successful in his or her trades. Trading in the stock and option markets is risky and uncertain. Each trader must make trading decisions for his or her own account, and take responsibility for the consequences.
License
All content on Tim Bovee, Private Trader by Timothy K. Bovee is licensed under a Creative Commons Attribution-ShareAlike 4.0 International License.
Based on a work at www.timbovee.com.

You must be logged in to post a comment.