3:30 p.m. New York time
Half an hour before the closing bell. The S&P 500 rose to the mid-4100s on the futures, about halfway into the likely price range where the upward movement that began on May 20 will end (marked with blue dashed lines on the chart). The rise from that date is wave C{-10} within an upward correction that began on May 12, wave 4{-9}. I count C{-10} as being in its 5th and final internal wave. I’ve updated the chart.
10:35 a.m. New York time
MRVL earnings play exit. I’ve exited my short bull put vertical spread on MRVL for 30.3% of maximum potential profit and have updated the trade analysis with full results.
9:35 a.m. New York time
After the weekend. The U.S. markets will be closed on Monday for the Memorial Day holiday. Trading will resume on Tuesday.
What’s happening now? The S&P 500 E-mini futures traded in a narrow range overnight, staying close to the lower boundary of the anticipated price target for the rise that began on May 20.
What does it mean? The rising last segment of the upward corrective pattern that began on May 12 is still underway and has a bit more upside potential remaining. I expect the segment to end in a range between 4047.50 and 4203.50 (marked with blue dashed lines on the chart).
What’s the alternative? The present rise will most likely be the end of the upward correction, but it’s possible that the correction will take a compound form, connecting two or three corrective patterns together.
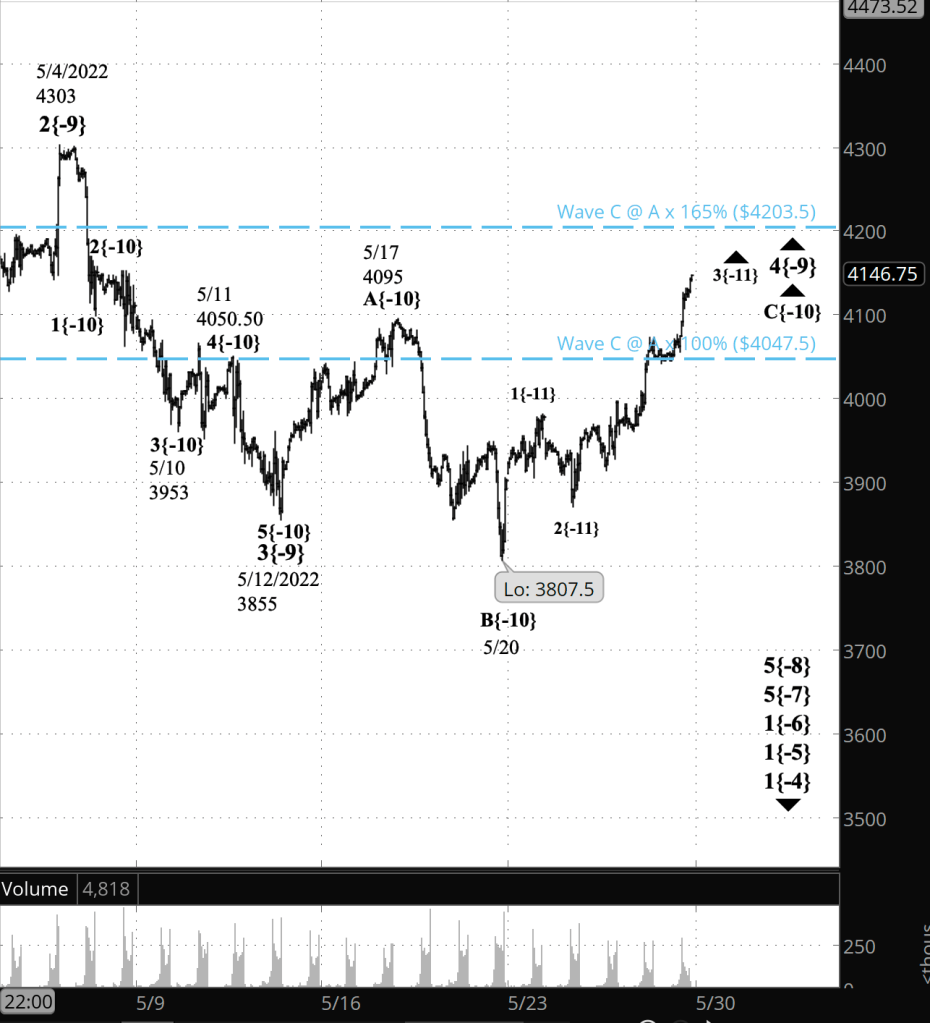
What does Elliott wave theory say? Under my principal analysis, wave C{-10}, the final wave of the three-wave Flat corrective pattern that is forming the upward correction that began on May 12, wave 4{-9}, is continuing. Wave C{-10} began on May 20. I see the C wave as being in its 4th wave correction internally, which will be followed by a final upward move, wave 5{-11} within C{-10}.
Normally, 4th waves have a single corrective pattern, usually consisting of three subwaves, within them, but sometimes they form a compound structure build from two or three corrective patterns, separated from each other by a connecting wave, which would be wave X{-10} in this case.
Whether wave 4{-9} is simple or compound, it will be followed by wave 5{-9}, a resumption of the downtrend, wave 5{-8}, that began on April 21.
We Are Here.
These are the waves currently in progress under my principal analysis. Each line on the list shows the wave number, with the subscript in curly brackets, the traditional degree name, the starting date, the starting price of the S&P 500 E-mini futures, and the direction of the wave.
- S&P 500 Index:
- 5{+3} Supercycle, 7/8/1932, 4.40 (up)
- 5{+2} Cycle, 12/9/1974, 60.96 (up)
- 5{+1} Primary, 3/6/2009, 666.79 (up)
- 5{0} Intermediate, 12/26/2018, 2346.58 (up)
- 4{-1} Minor, 1/4/2022 4818.62 (down)
- 1{-2} Minute, 1/4/2022 4818.62 (down)
- S&P 500 Futures and index:
- 1{-3} Minuette, 1/4/2022, 4808.25 (down) (futures), 4818.62 (down) (index)
- S&P 500 Futures:
- 1{-4} Subminuette, 1/4/2022, 4808.25 (down)
- 1{-5} Micro, 1/4/2022, 4808.25 (down)
- 1{-6} Submicro, 1/4/2022, 4808.25 (down)
- 5{-7} Minuscule, 3/29/2022, 4631 (down)
- 5{-8} Subminuscule, 4/21/2022, 4509, (down)
Learning and other resources. Elliott wave analysis provides context, not prophecy. As the 20th century semanticist Alfred Korzybski put it in his book Science and Sanity (1933), “The map is not the territory … The only usefulness of a map depends on similarity of structure between the empirical world and the map.” And I would add, in the ever-changing markets, we can judge that similarity of structure only after the fact.
See the menu page Analytical Methods for a rundown on where to go for information on Elliott wave analysis.
By Tim Bovee, Portland, Oregon, May 27, 2022
Disclaimer
Tim Bovee, Private Trader tracks the analysis and trades of a private trader for his own accounts. Nothing in this blog constitutes a recommendation to buy or sell stocks, options or any other financial instrument. The only purpose of this blog is to provide education and entertainment.
No trader is ever 100 percent successful in his or her trades. Trading in the stock and option markets is risky and uncertain. Each trader must make trading decisions for his or her own account, and take responsibility for the consequences.
License
All content on Tim Bovee, Private Trader by Timothy K. Bovee is licensed under a Creative Commons Attribution-ShareAlike 4.0 International License.
Based on a work at www.timbovee.com.

You must be logged in to post a comment.