10:17 a.m. New York time
What’s happening now? The U.S. markets were closed today — Monday — for the Memorial Day holiday. However, the S&P 500 E-mini futures resumed trading Sunday. The price reached 4802.25 in overnight trading and then fell.
What does it mean? The overnight peak was less than two points below the upper boundary of the likely price target for the final segment of the upward correction that began on May 12. The subsequent decline carried the price down more than 60 points.
By my count, the final segment internally has completed three subwaves and is now in its second correction. When that internal correction has ended, price will rise again, most likely exceeding the overnight high, ending the upward correction that began on May 12.
What’s the alternative? The likely price target was calculated according to a tendency identified in Elliott wave analysis regarding the final segment’s retracement of the first segment of a correction taking the Flat pattern. More on that calculation in the Elliott wave theory section, below. Long story short: The target range is a tendency, not a firm rule, and it’s possible that the final segment will end below the overnight low, or that it will move beyond the upper boundary of the range.
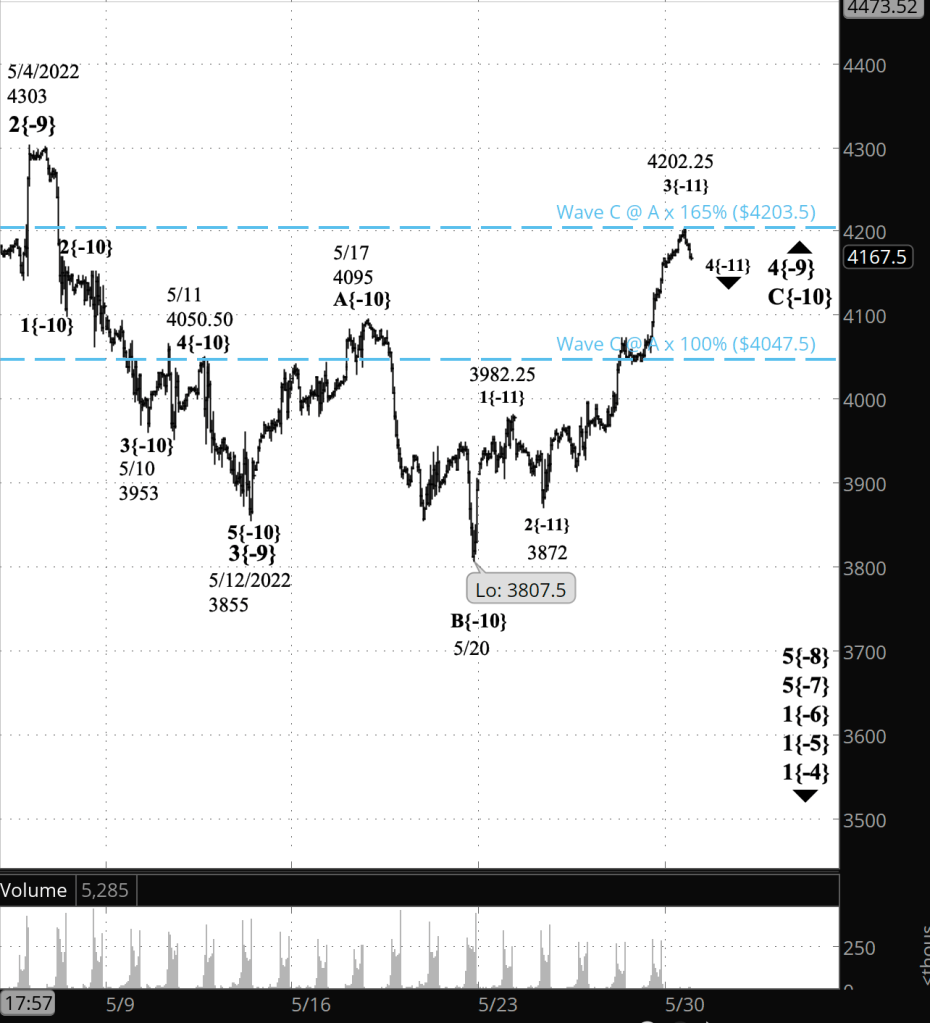
What does Elliott wave theory say? Wave C{-10} within an upward correction, wave 4{-9}, is nearing its end. Internally, wave 3{-11} ended at the overnight high, and wave 4{-11}, a downward correction, is now underway. Wave 5{-11} will follow and will complete wave C{-10}.
The wave 4{-9} correction is taking the form of a Flat, and C waves in Flats will often retrace 100% to 165% of the preceding A wave, giving a target price range of 4047.50 to 4203.50. I’ve marked those levels on the chart with blue dashed lines.
We Are Here.
These are the waves currently in progress under my principal analysis. Each line on the list shows the wave number, with the subscript in curly brackets, the traditional degree name, the starting date, the starting price of the S&P 500 E-mini futures, and the direction of the wave.
- S&P 500 Index:
- 5{+3} Supercycle, 7/8/1932, 4.40 (up)
- 5{+2} Cycle, 12/9/1974, 60.96 (up)
- 5{+1} Primary, 3/6/2009, 666.79 (up)
- 5{0} Intermediate, 12/26/2018, 2346.58 (up)
- 4{-1} Minor, 1/4/2022 4818.62 (down)
- 1{-2} Minute, 1/4/2022 4818.62 (down)
- S&P 500 Futures and index:
- 1{-3} Minuette, 1/4/2022, 4808.25 (down) (futures), 4818.62 (down) (index)
- S&P 500 Futures:
- 1{-4} Subminuette, 1/4/2022, 4808.25 (down)
- 1{-5} Micro, 1/4/2022, 4808.25 (down)
- 1{-6} Submicro, 1/4/2022, 4808.25 (down)
- 5{-7} Minuscule, 3/29/2022, 4631 (down)
- 5{-8} Subminuscule, 4/21/2022, 4509, (down)
Learning and other resources. Elliott wave analysis provides context, not prophecy. As the 20th century semanticist Alfred Korzybski put it in his book Science and Sanity (1933), “The map is not the territory … The only usefulness of a map depends on similarity of structure between the empirical world and the map.” And I would add, in the ever-changing markets, we can judge that similarity of structure only after the fact.
See the menu page Analytical Methods for a rundown on where to go for information on Elliott wave analysis.
By Tim Bovee, Portland, Oregon, May 31, 2022
Disclaimer
Tim Bovee, Private Trader tracks the analysis and trades of a private trader for his own accounts. Nothing in this blog constitutes a recommendation to buy or sell stocks, options or any other financial instrument. The only purpose of this blog is to provide education and entertainment.
No trader is ever 100 percent successful in his or her trades. Trading in the stock and option markets is risky and uncertain. Each trader must make trading decisions for his or her own account, and take responsibility for the consequences.
License
All content on Tim Bovee, Private Trader by Timothy K. Bovee is licensed under a Creative Commons Attribution-ShareAlike 4.0 International License.
Based on a work at www.timbovee.com.

You must be logged in to post a comment.