3:30 p.m. New York time
Half an hour before the closing bell. The S&P 500 reversed to the upside early in the session, remaining below the high, 4202.25, attained in overnight futures trading.
Under my principal count, the decline is wave A{-12} within wave 4{-11} within wave C{-10}, which is the third wave of an upward corrective pattern, wave 4{-9}, that began on May 12. the bounce up maybe the start of wave B{-12}, or perhaps a subwave within an ongoing wave A{-12}.
Under my Alternative #1 analysis, the decline during the session is part of wave 1{-10} within downtrending wave 5{-9}.
No change in the analysis. I’ve updated the chart.
9:35 a.m. New York time
What’s happening now? The S&P 500 E-mini futures continued to fall in overnight trading.
What does it mean? The decline is a downward correction within the final, upward leg of a larger upward correction. It will be followed by a final move to the upside that likely will move above the May 30 peak, 4303, and that will complete the larger upward correction, unless it takes a complex form. The end of the correction will be followed by a signifiant decline, a resumption of the downtrend that began on April 21 from 4509. The price has come within two points of reaching the upper boundary of the price target, 4203.51. The price target range is marked with blue dashed lines on the chart.
What are the alternatives? There are three:
Alternative #1: The May 30 peak marks the end of the larger upward correction and the downtrend that began on April 21 has resumed. I don’t think this alternative matches the internal wave count, but there is always a degree of uncertainty in any Elliott wave analysis.
Alternative #2: The final move to the upside may fall short of the May 30 peak, a condition known as truncation. Or it could move beyond the peak.
Alternative #3: Most corrections have three waves internally. Sometimes a correction will connect two or three corrective patterns together before reaching its end. The present corrective pattern is in its 19th day, and a compound correction could roughly double or triple the time until the S&P 500 resumes its downtrend.
The price target range (blue dashed lines on the chart) is calculated by using the length of wave A{-10} for the lower boundary and 1.65 times the length of wave A{-10} for the upper boundary, a common range for C waves within a 4th wave that is forming a Flat pattern. That price target range is a tendency, but not a firm rule. The price could move beyond the boundary before wave C{-10} is complete.
A firm rule of Elliott wave analysis is that a 4th wave can’t move beyond the start of the preceding 1st wave. Wave 1{-9} began on April 21 from 4509. So wave 4{-9}, whether it turns out to be simple or complex, can’t move beyond that price.
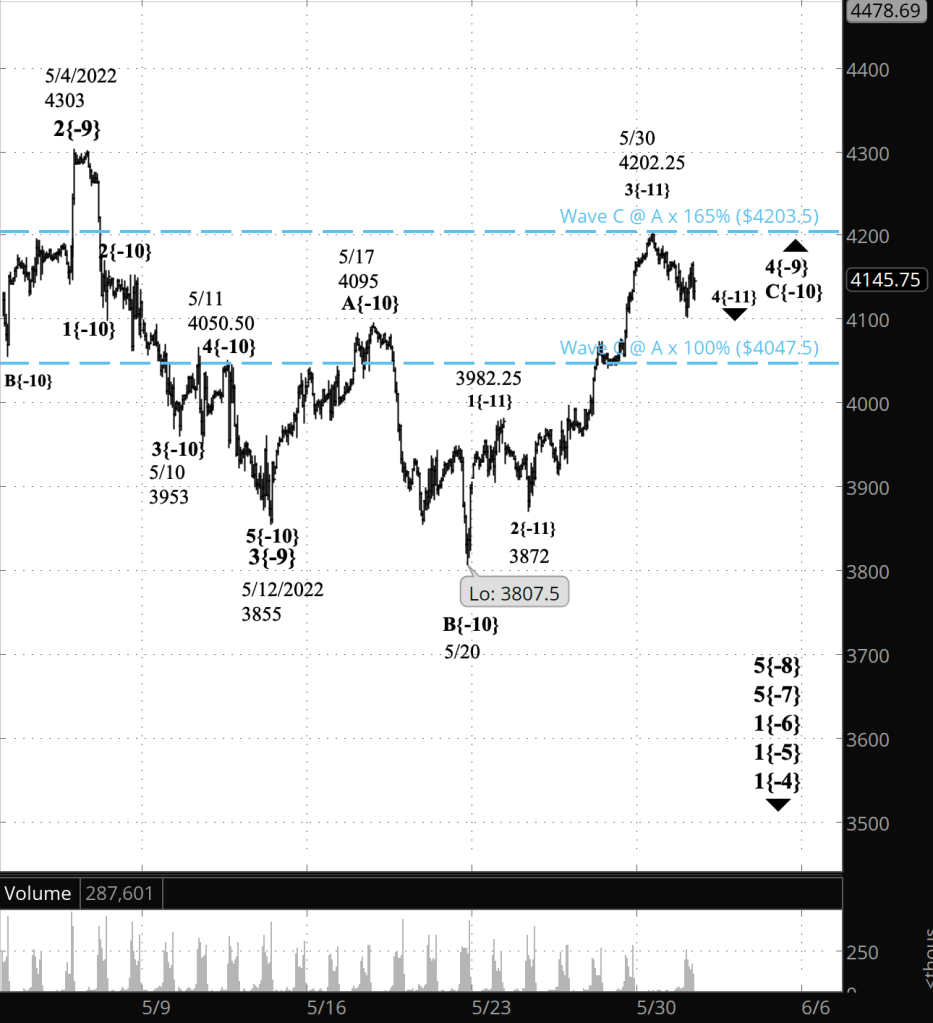
What does Elliott wave theory say? Under my principal analysis, the May 30 peak ended wave 3{-11} within wave C{-10} within the upward correction, wave 4{-9}. Wave 4{-11} is now underway, and it will be followed by rising wave 5{-11}, which will likely rise above the 4303 peak of May 30 and when complete will be the end of wave C{-10} and most likely the end of wave 4{-9}. When 4{-9} is complete, the downtrend will resume as wave 5{-9}, which will carry the price back down to the 3800s and perhaps below.
Under Alternative #1, wave C{-10} ended at the May 30 peak. I can’t find a wave count within wave C{-10} that, within the rules of Elliott wave analysis, would allow this interpretation, but I recognize the ambiguities in the count that make it a possibility.
Under Alternative #2, the upward wave 5{-11} that will follow the present wave 4{-11} pullback will fall short of 4303, the May 30 peak, in a truncated 5th.
Under Alternative #3, the end of wave C{-10} won’t be the end of its parent, wave 4{-9}. Instead, wave C{-10} will be followed by a downward connecting wave, X{-10} and then a second corrective pattern, which possibly will be followed by another connecting wave and then third corrective pattern.
We Are Here.
These are the waves currently in progress under my principal analysis. Each line on the list shows the wave number, with the subscript in curly brackets, the traditional degree name, the starting date, the starting price of the S&P 500 E-mini futures, and the direction of the wave.
- S&P 500 Index:
- 5{+3} Supercycle, 7/8/1932, 4.40 (up)
- 5{+2} Cycle, 12/9/1974, 60.96 (up)
- 5{+1} Primary, 3/6/2009, 666.79 (up)
- 5{0} Intermediate, 12/26/2018, 2346.58 (up)
- 4{-1} Minor, 1/4/2022 4818.62 (down)
- 1{-2} Minute, 1/4/2022 4818.62 (down)
- S&P 500 Futures and index:
- 1{-3} Minuette, 1/4/2022, 4808.25 (down) (futures), 4818.62 (down) (index)
- S&P 500 Futures:
- 1{-4} Subminuette, 1/4/2022, 4808.25 (down)
- 1{-5} Micro, 1/4/2022, 4808.25 (down)
- 1{-6} Submicro, 1/4/2022, 4808.25 (down)
- 5{-7} Minuscule, 3/29/2022, 4631 (down)
- 5{-8} Subminuscule, 4/21/2022, 4509, (down)
Learning and other resources. Elliott wave analysis provides context, not prophecy. As the 20th century semanticist Alfred Korzybski put it in his book Science and Sanity (1933), “The map is not the territory … The only usefulness of a map depends on similarity of structure between the empirical world and the map.” And I would add, in the ever-changing markets, we can judge that similarity of structure only after the fact.
See the menu page Analytical Methods for a rundown on where to go for information on Elliott wave analysis.
By Tim Bovee, Portland, Oregon, May 31, 2022
Disclaimer
Tim Bovee, Private Trader tracks the analysis and trades of a private trader for his own accounts. Nothing in this blog constitutes a recommendation to buy or sell stocks, options or any other financial instrument. The only purpose of this blog is to provide education and entertainment.
No trader is ever 100 percent successful in his or her trades. Trading in the stock and option markets is risky and uncertain. Each trader must make trading decisions for his or her own account, and take responsibility for the consequences.
License
All content on Tim Bovee, Private Trader by Timothy K. Bovee is licensed under a Creative Commons Attribution-ShareAlike 4.0 International License.
Based on a work at www.timbovee.com.

[…] What are the alternatives? The same three as those listed in yesterday’s Trader’s Notebook. […]
LikeLike