3:30 p.m. New York time
Half an hour before the closing bell. The S&P 500 fell during the trading session, reaching a low of 4096.75 on the futures, and then rose slightly. The movement is consistent with this morning’s principal analysis: Rising wave 5{-11} within rising wave C{-10} within an upward correction, wave 4{-9], is underway. The depth of the pullback suggests an additional alternative analysis: Wave 4{-11}, a downward correction within wave C{-10}, is still underway. I’m not ready to adopt that as the principal analysis yet, but it’s a possibility.
I’ve updated the chart.
9:35 a.m. New York time
What’s happening now? The S&P 500 E-mini futures rose to 4189 in overnight trading and then reversed, dropping by almost 60 points. At the overnight peak the price was within 14 points of the upper boundary of the target price range (the dashed blue lines on the chart).
What does it mean? The overnight peak ended the middle segment of the rise that began on June 1. After a small downward correction, that rise will resume in the final segment of the rise that began on May 20. When that rise is complete, it will also, most likely, mark the end of the upward correction that began on May 12 from 3855.
What are the alternatives? There are two.
Alternative #1: The overnight peak may have marked the end of the rise that began on May 20. That interpretation of the chart seems like a stretch to me, but charts always contain ambiguities, so i can’t rule it out entirely.
Alternative #2: The overnight peak marked the end of a three-segment corrective pattern, an upward correction that began on May 12.
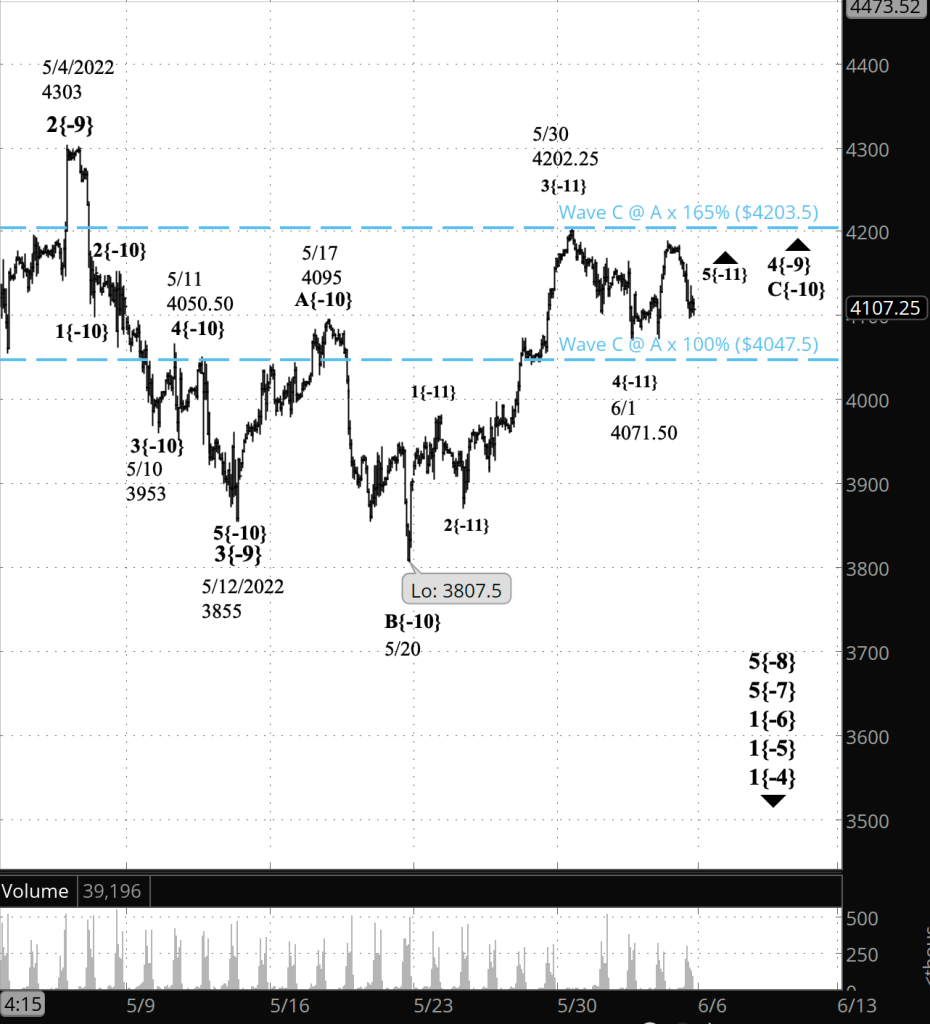
What does Elliott wave theory say? In my principal analysis, the overnight peak, marked the end of wave 3{-12}, the middle wave of a five-wave pattern within wave 5{-11}, which in turn is the final wave of wave C{-9}. That C wave is likely to be the final wave of an upward correction, wave 4{9}, that began on May 12.
Under alternative #1, the overnight peak, 4189, was the end of wave 5{-12], the final wave within 5{-11} and its parent C{-10}, and it most likely marks the end of wave 4{-9}.
Under alternative #2, wave 4{-9} take for a compound structure. The three-wave pattern that will end with wave C{-10} will be followed by a downward connector, wave X{-10}, and then another corrective pattern.
The two blue dashed lines on the chart are the price range of the likely ending level of wave C{-10}. A tendency, according to Elliott wave analysis, is from wave C at a minimum to be the same length as the preceding wave A or to be up to 65% longer than wave A. The upper line marks the 65% longer level (4203.50), and the lower line marks the same length level (4047.50).
We Are Here.
These are the waves currently in progress under my principal analysis. Each line on the list shows the wave number, with the subscript in curly brackets, the traditional degree name, the starting date, the starting price of the S&P 500 E-mini futures, and the direction of the wave.
- S&P 500 Index:
- 5{+3} Supercycle, 7/8/1932, 4.40 (up)
- 5{+2} Cycle, 12/9/1974, 60.96 (up)
- 5{+1} Primary, 3/6/2009, 666.79 (up)
- 5{0} Intermediate, 12/26/2018, 2346.58 (up)
- 4{-1} Minor, 1/4/2022 4818.62 (down)
- 1{-2} Minute, 1/4/2022 4818.62 (down)
- S&P 500 Futures and index:
- 1{-3} Minuette, 1/4/2022, 4808.25 (down) (futures), 4818.62 (down) (index)
- S&P 500 Futures:
- 1{-4} Subminuette, 1/4/2022, 4808.25 (down)
- 1{-5} Micro, 1/4/2022, 4808.25 (down)
- 1{-6} Submicro, 1/4/2022, 4808.25 (down)
- 5{-7} Minuscule, 3/29/2022, 4631 (down)
- 5{-8} Subminuscule, 4/21/2022, 4509, (down)
Learning and other resources. Elliott wave analysis provides context, not prophecy. As the 20th century semanticist Alfred Korzybski put it in his book Science and Sanity (1933), “The map is not the territory … The only usefulness of a map depends on similarity of structure between the empirical world and the map.” And I would add, in the ever-changing markets, we can judge that similarity of structure only after the fact.
See the menu page Analytical Methods for a rundown on where to go for information on Elliott wave analysis.
By Tim Bovee, Portland, Oregon, June 3, 2022
Disclaimer
Tim Bovee, Private Trader tracks the analysis and trades of a private trader for his own accounts. Nothing in this blog constitutes a recommendation to buy or sell stocks, options or any other financial instrument. The only purpose of this blog is to provide education and entertainment.
No trader is ever 100 percent successful in his or her trades. Trading in the stock and option markets is risky and uncertain. Each trader must make trading decisions for his or her own account, and take responsibility for the consequences.
License
All content on Tim Bovee, Private Trader by Timothy K. Bovee is licensed under a Creative Commons Attribution-ShareAlike 4.0 International License.
Based on a work at www.timbovee.com.

You must be logged in to post a comment.