3:30 p.m. New York time
Half an hour before the closing bell. The S&P 500 rose, coming close the upper boundary of the price target range, and then retreated, remaining well above the lower boundary of the range.
So looking at the larger movements since June 1, we have three waves: Up, down and up again, but not as much.
Under my principal analysis, wave 4{-11} ended on June 1, and today’s movements are wave 1{-12}, 2{-12} and the beginning of 3{-12} within wave uptrending wave 5{-11}. Or perhaps wave 2{-12} is still underway.
Under my alternative analysis, the June 1 low is the end of wave A{-12} within wave 4{-11}. Today’s movements: The up wave is wave B{-12}, which may have ended at today’s peak. The subsequent downward movement and upward retreat are wave C{-12} and is still underway.
If the price moves above the upper price target boundary, that lends credence to the principal scenario. If it moves below the lower boundary, then the alternative scenario gain credence.
I’ve updated the chart.
9:35 a.m. New York time
What’s happening now? The S&P 500 E-mini futures rose in overnight trading, returning to the mid-4100s.
What does it mean? The final segment within the third and probably the last leg of an upward correction that began on May 12 is underway. The price remains within the projected range of the end of that upward correction (dashed blue lines on the chart), between 4203.50 and 4047.50.
What is the alternative? The next-to-the-last segment within the third leg of the upward correction is still underway.
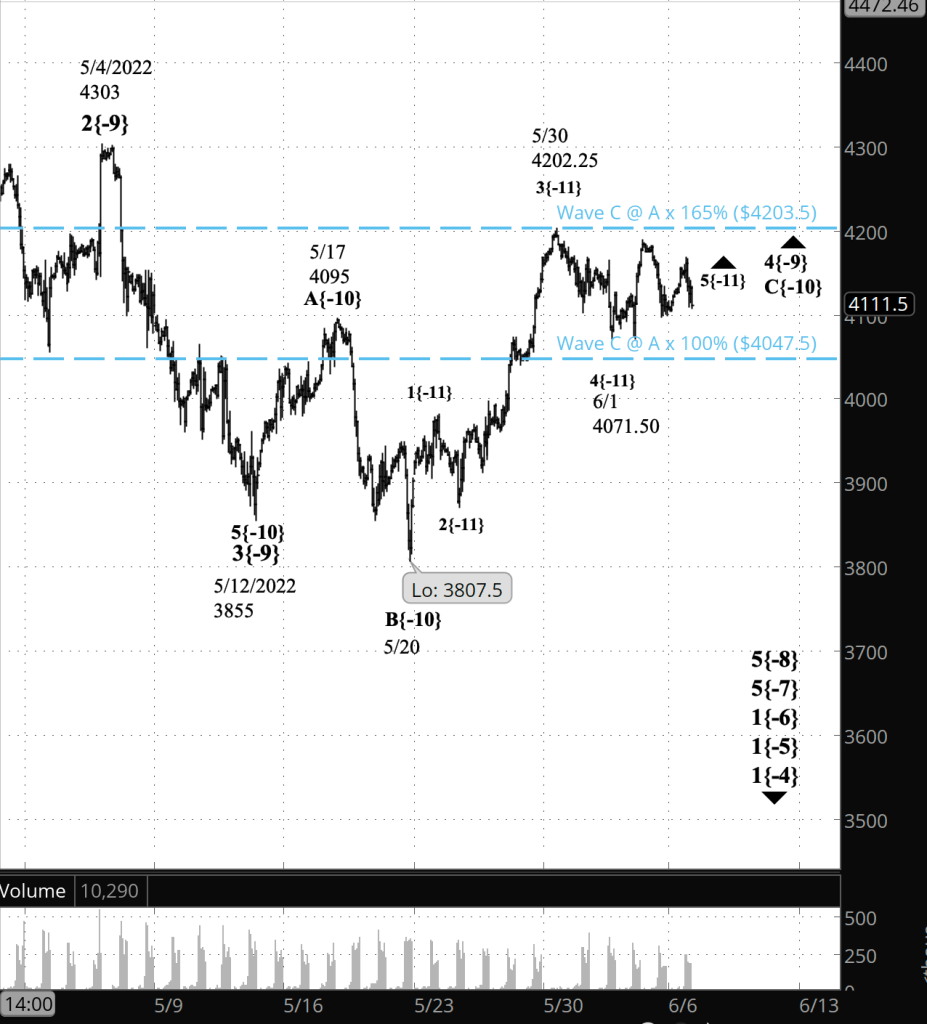
What does Elliott wave theory say? Under my principal analysis, wave 5{-11} within wave C{-10} is underway. All of this is happening within wave 4{-9}, an upward correction that began on May 12, within wave 5{-8}, a downtrend that began on January 4.
Under my alternative analysis, wave 4{-11} within wave C{-10} is not yet complete. When it’s done, it will be followed by upward wave 5{-11}.
The wave 4{-9} correction is forming a Flat pattern, with three waves within wave A, three in B and five waves within wave C. I hedged my placement of wave C — “probably the last leg of an upward correction” — because sometimes corrections form a compound pattern, linking two or three corrective patterns together.
We Are Here.
These are the waves currently in progress under my principal analysis. Each line on the list shows the wave number, with the subscript in curly brackets, the traditional degree name, the starting date, the starting price of the S&P 500 E-mini futures, and the direction of the wave.
- S&P 500 Index:
- 5{+3} Supercycle, 7/8/1932, 4.40 (up)
- 5{+2} Cycle, 12/9/1974, 60.96 (up)
- 5{+1} Primary, 3/6/2009, 666.79 (up)
- 5{0} Intermediate, 12/26/2018, 2346.58 (up)
- 4{-1} Minor, 1/4/2022 4818.62 (down)
- 1{-2} Minute, 1/4/2022 4818.62 (down)
- S&P 500 Futures and index:
- 1{-3} Minuette, 1/4/2022, 4808.25 (down) (futures), 4818.62 (down) (index)
- S&P 500 Futures:
- 1{-4} Subminuette, 1/4/2022, 4808.25 (down)
- 1{-5} Micro, 1/4/2022, 4808.25 (down)
- 1{-6} Submicro, 1/4/2022, 4808.25 (down)
- 5{-7} Minuscule, 3/29/2022, 4631 (down)
- 5{-8} Subminuscule, 4/21/2022, 4509, (down)
Learning and other resources. Elliott wave analysis provides context, not prophecy. As the 20th century semanticist Alfred Korzybski put it in his book Science and Sanity (1933), “The map is not the territory … The only usefulness of a map depends on similarity of structure between the empirical world and the map.” And I would add, in the ever-changing markets, we can judge that similarity of structure only after the fact.
See the menu page Analytical Methods for a rundown on where to go for information on Elliott wave analysis.
By Tim Bovee, Portland, Oregon, June 6, 2022
Disclaimer
Tim Bovee, Private Trader tracks the analysis and trades of a private trader for his own accounts. Nothing in this blog constitutes a recommendation to buy or sell stocks, options or any other financial instrument. The only purpose of this blog is to provide education and entertainment.
No trader is ever 100 percent successful in his or her trades. Trading in the stock and option markets is risky and uncertain. Each trader must make trading decisions for his or her own account, and take responsibility for the consequences.
License
All content on Tim Bovee, Private Trader by Timothy K. Bovee is licensed under a Creative Commons Attribution-ShareAlike 4.0 International License.
Based on a work at www.timbovee.com.

[…] correction, which began on May 30, is still underway, promoting the alternative analysis in yesterday’s Trader’s Notebook to the principal analysis. Further decline will confirm this […]
LikeLike