3:30 p.m. New York time
Half an hour before the closing bell. The S&P 500 declined during the session, reaching a low of 4076 on the futures, and then reversed upward. Wave C{-12} to the downside is still underway. The C wave can be expected to have five waves internally, whether the parent, wave 4{-11}, a downward correction, takes the form of a Flat or a Zigzag. So far wave C has completed three waves internally and today’s upward movement means that it is now in its 4th internal wave.
I’ve updated the chart.
9:35 a.m. New York time
What’s happening now? The S&P 500 E-mini futures fell in overnight trading, returning to the upper 4000s.
What does it mean? The depth of the decline strengthens the case that a downward correction, which began on May 30, is still underway, promoting the alternative analysis in yesterday’s Trader’s Notebook to the principal analysis. Further decline will confirm this scenario.
What is the alternative? The downward correction from May 30 ended on June 1 and a the uptrend that began on May 20 has resumed. A reversal to the upside will confirm this scenario.
Chart. Both the principal and the alternative analyses describe low-level movements within a larger upward correction that began on May 12. The price target range for that larger upward correction is 4047.50 to 4203.50, marked on the chart with blue dashed lines.
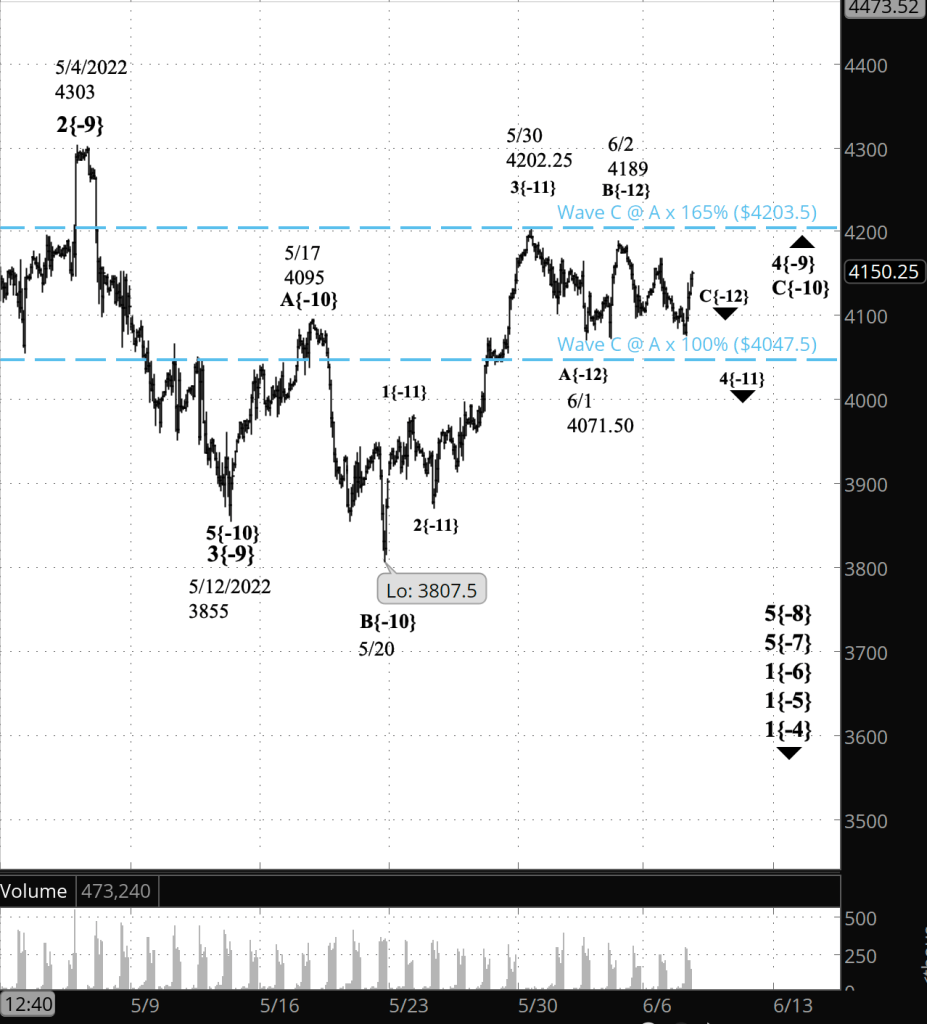
What does Elliott wave theory say? Under the principal analysis, the overnight decline is wave C{-12} within an upward correction, wave 4{-11}. Under the alternative analysis, the decline is part of uptrending wave 5{-11}.
Both scenarios are part of wave C{-10}, the final wave of a pattern within an upward correction, wave 4{-9}. This is all happening within wave 5{-8}, a downtrend that began on April 21 that is a wave of lower degree within a series of downtrends of increasingly higher degree, up to wave 4{-1}, which began on January 4.
We Are Here.
These are the waves currently in progress under my principal analysis. Each line on the list shows the wave number, with the subscript in curly brackets, the traditional degree name, the starting date, the starting price of the S&P 500 E-mini futures, and the direction of the wave.
- S&P 500 Index:
- 5{+3} Supercycle, 7/8/1932, 4.40 (up)
- 5{+2} Cycle, 12/9/1974, 60.96 (up)
- 5{+1} Primary, 3/6/2009, 666.79 (up)
- 5{0} Intermediate, 12/26/2018, 2346.58 (up)
- 4{-1} Minor, 1/4/2022 4818.62 (down)
- 1{-2} Minute, 1/4/2022 4818.62 (down)
- S&P 500 Futures and index:
- 1{-3} Minuette, 1/4/2022, 4808.25 (down) (futures), 4818.62 (down) (index)
- S&P 500 Futures:
- 1{-4} Subminuette, 1/4/2022, 4808.25 (down)
- 1{-5} Micro, 1/4/2022, 4808.25 (down)
- 1{-6} Submicro, 1/4/2022, 4808.25 (down)
- 5{-7} Minuscule, 3/29/2022, 4631 (down)
- 5{-8} Subminuscule, 4/21/2022, 4509, (down)
Learning and other resources. Elliott wave analysis provides context, not prophecy. As the 20th century semanticist Alfred Korzybski put it in his book Science and Sanity (1933), “The map is not the territory … The only usefulness of a map depends on similarity of structure between the empirical world and the map.” And I would add, in the ever-changing markets, we can judge that similarity of structure only after the fact.
See the menu page Analytical Methods for a rundown on where to go for information on Elliott wave analysis.
By Tim Bovee, Portland, Oregon, June 7, 2022
Disclaimer
Tim Bovee, Private Trader tracks the analysis and trades of a private trader for his own accounts. Nothing in this blog constitutes a recommendation to buy or sell stocks, options or any other financial instrument. The only purpose of this blog is to provide education and entertainment.
No trader is ever 100 percent successful in his or her trades. Trading in the stock and option markets is risky and uncertain. Each trader must make trading decisions for his or her own account, and take responsibility for the consequences.
License
All content on Tim Bovee, Private Trader by Timothy K. Bovee is licensed under a Creative Commons Attribution-ShareAlike 4.0 International License.
Based on a work at www.timbovee.com.

You must be logged in to post a comment.