3:36 p.m. New York time
Less than half an hour before the closing bell. Always embarrassing for a post to be outdated within six minutes. The downtrend that began on June 6 continues. Wave 3{-12} within wave 3{-11} within wave 1{-10} within wave 5{-9} is the location.
3:30 p.m. New York time
Half an hour before the closing bell. The decline that began on June 6 continued during the session, reversing from a low of 3750.50 in a small upward correction that is still underway. The small correction is wave 4{-12} within wave 3{-11} within wave 1{-10} within wave 5{-9}. No change in the analysis. I’ve updated the chart.
9:35 a.m. New York time
What’s happening now? The S&P 500 E-mini futures gapped below Friday’s close when trading resumed overnight. The decline continued, with the price reaching levels not seen since early last year.
What does it mean? The first leg of the decline that began on May 30 continues. Internally, that initial portion of the downtrend is in its middle, most energetic phase. The initial portion of the downtrend will be followed by its first internal correction, an upward move that will remain below 4202.25, the beginning of the downtrend. The first correction in a downtrend often takes back enough of the preceding decline to persuade traders that the bull market has returned, multiplying the shock when the downtrend resumes, as it will.
What are the alternatives? None at this point. The chart shows a straightforward downtrend.
The Chart. I’ve moved in for a close-up view to better understand where we stand within the initial phase of the downtrend. For a broader view of the futures, see Friday’s Trader’s Notebook, and for a still broader view, of the index, see Thursday’s edition.
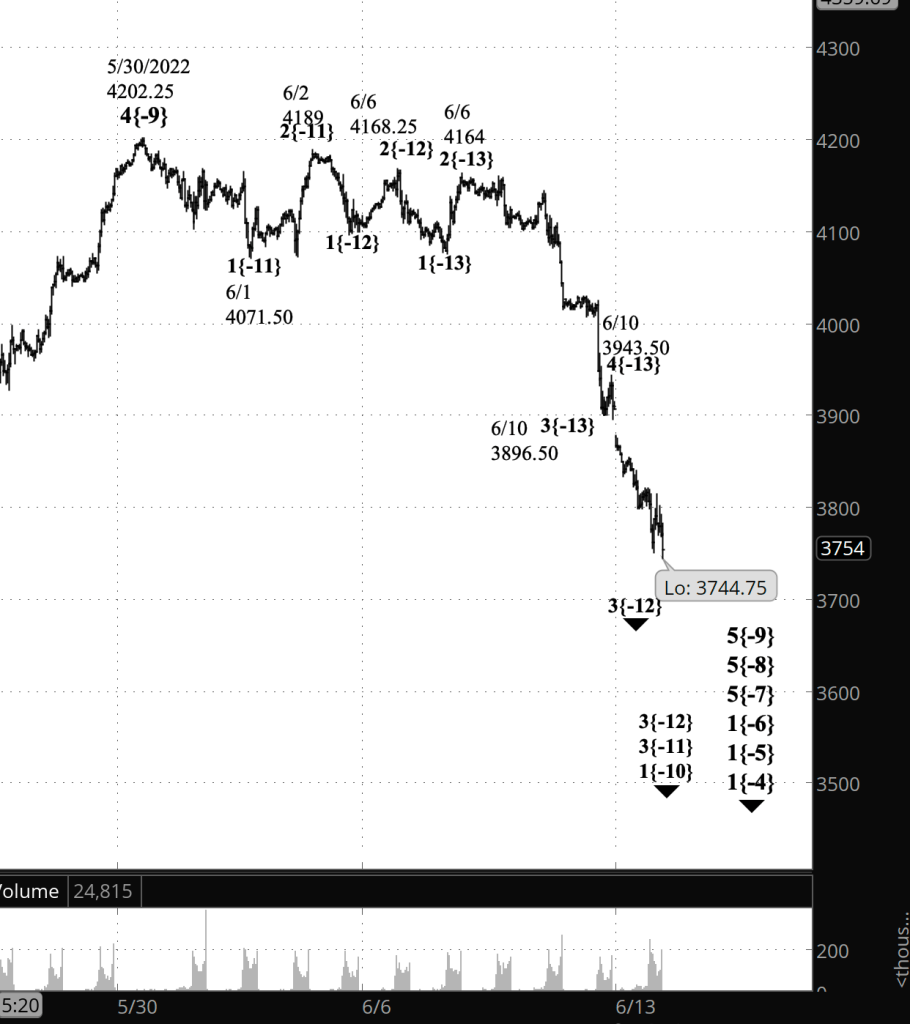
What does Elliott wave theory say? The downtrend that began May 30 is wave 4{-9}, starting from 4202.25. Internally, it is subdividing in the normal fashion, a series of ever smaller downtrends and correction that illustrate the fractal structure of the market’s movements.
Within wave 4{-9}, wave 1{-10} is underway. The present decline, which began June 10 from 3943.50, is three levels smaller, wave 5{-13}, within wave 3{-12}, which began June 6 from 4861.25, within wave 3{-11}, which began June 2 from 4189.
Third waves are almost always the most energetic, the most dramatic, of all of the waves in a trend, with 5th waves often coming in next. What we see here is a 5th wave set within two 3rd wave, each of higher degree, which explains the energy of the overnight decline.
Wave 1{-9} will be followed by an upward correction, wave 2{-9}, and then by the main event: A dramatic resumption of the downtrend as wave 3{-9} begins.
This is all happening within wave 5{-8}, a larger downtrend that began on April 21 from 4509.
We Are Here.
These are the waves currently in progress under my principal analysis. Each line on the list shows the wave number, with the subscript in curly brackets, the traditional degree name, the starting date, the starting price of the S&P 500 E-mini futures, and the direction of the wave.
- S&P 500 Index:
- 5{+3} Supercycle, 7/8/1932, 4.40 (up)
- 5{+2} Cycle, 12/9/1974, 60.96 (up)
- 5{+1} Primary, 3/6/2009, 666.79 (up)
- 5{0} Intermediate, 12/26/2018, 2346.58 (up)
- 4{-1} Minor, 1/4/2022 4818.62 (down)
- 1{-2} Minute, 1/4/2022 4818.62 (down)
- S&P 500 Futures and index:
- 1{-3} Minuette, 1/4/2022, 4808.25 (down) (futures), 4818.62 (down) (index)
- S&P 500 Futures:
- 1{-4} Subminuette, 1/4/2022, 4808.25 (down)
- 1{-5} Micro, 1/4/2022, 4808.25 (down)
- 1{-6} Submicro, 1/4/2022, 4808.25 (down)
- 5{-7} Minuscule, 3/29/2022, 4631 (down)
- 5{-8} Subminuscule, 4/21/2022, 4509, (down)
Learning and other resources. Elliott wave analysis provides context, not prophecy. As the 20th century semanticist Alfred Korzybski put it in his book Science and Sanity (1933), “The map is not the territory … The only usefulness of a map depends on similarity of structure between the empirical world and the map.” And I would add, in the ever-changing markets, we can judge that similarity of structure only after the fact.
See the menu page Analytical Methods for a rundown on where to go for information on Elliott wave analysis.
By Tim Bovee, Portland, Oregon, June 13, 2022
Disclaimer
Tim Bovee, Private Trader tracks the analysis and trades of a private trader for his own accounts. Nothing in this blog constitutes a recommendation to buy or sell stocks, options or any other financial instrument. The only purpose of this blog is to provide education and entertainment.
No trader is ever 100 percent successful in his or her trades. Trading in the stock and option markets is risky and uncertain. Each trader must make trading decisions for his or her own account, and take responsibility for the consequences.
License
All content on Tim Bovee, Private Trader by Timothy K. Bovee is licensed under a Creative Commons Attribution-ShareAlike 4.0 International License.
Based on a work at www.timbovee.com.

You must be logged in to post a comment.