3:30 p.m. New York time
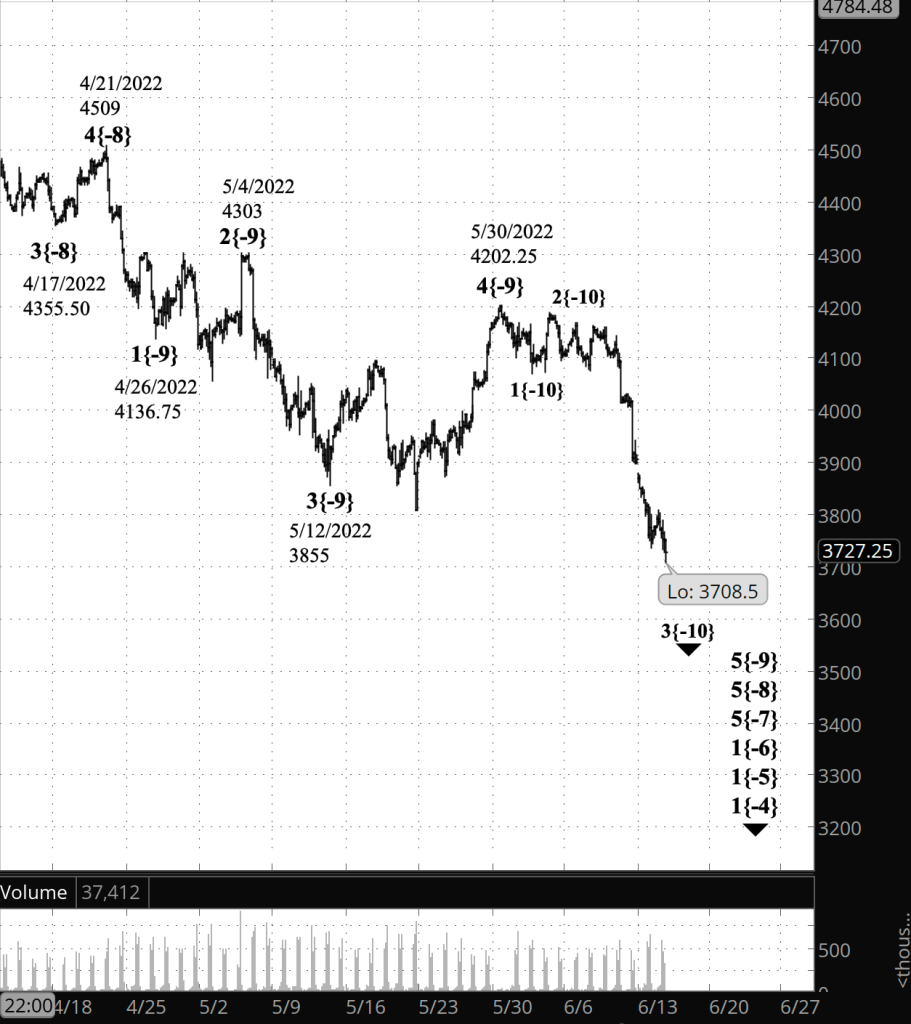
Half an hour before the closing bell. The S&P 500 continued to decline during the session, reaching the low 3700s. No change in the analysis. I’ve updated the upper (near-term) chart.
9:35 a.m. New York time
What’s happening now? The S&P 500 E-mini futures continued to decline in overnight trading, reaching the mid-3700s.
What does it mean? The middle segment within the last leg of a declined that began on April 21 is underway. That smaller, middle segment will be followed by an upward correction, and then a resumption of the downtrend that will end the larger last leg of the decline, also ending an even larger downtrend that began on January 4, which will be followed by a large upward correction, and then an even larger downtrend.
The decline underway since January 4 is still some distance away from its target ending range, 3085.29 to 2691.35. More on this in the Elliott wave section, below the charts.
What are the alternatives? I’ve adjusted sizes of the waves within the downtrend that began on May 30. As is often the case, where a wave fits in the hierarchy of waves is often ambiguous. Details
The Charts. The upper chart — the futures — focuses on the near term and shows the downtrend that began on April 21.
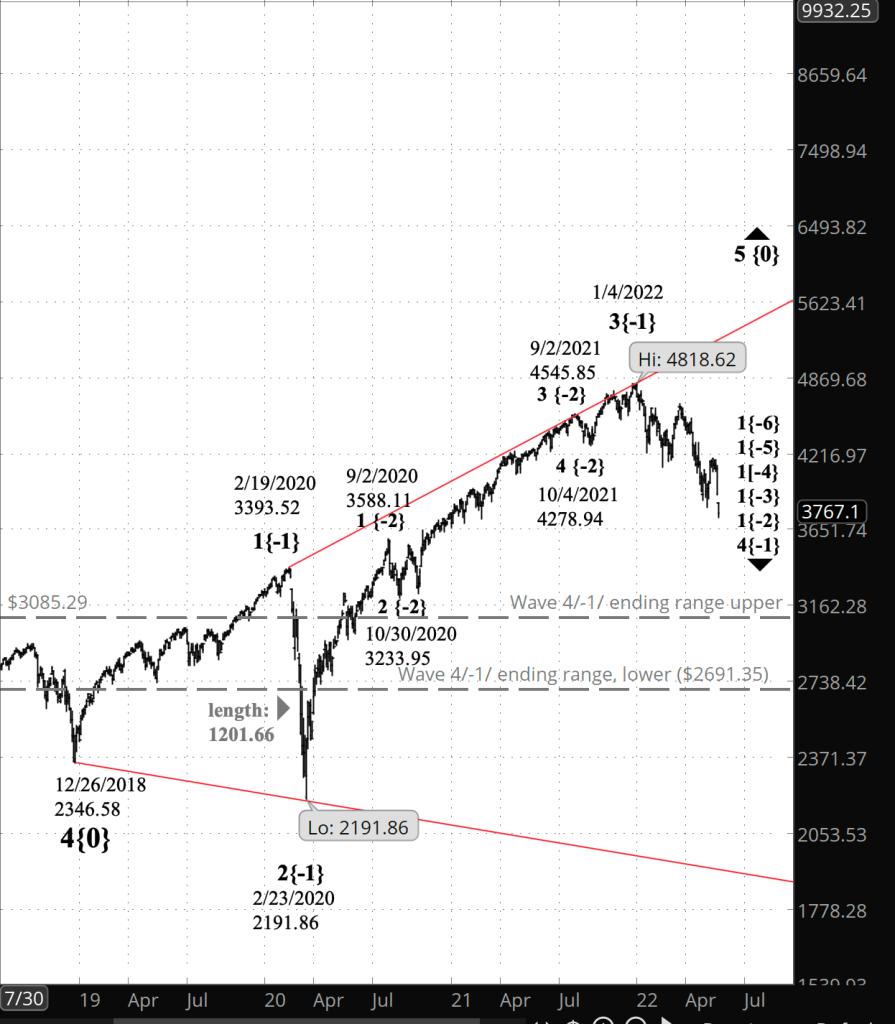
The lower chart — the index — focuses on the long term and shows the rise that began on December 26, 2018, and the the subsequent decline that began on January 4, 2022. The price target range of the present decline is marked by dashed lines on the lower chart.
What does Elliott wave theory say? Breaking with my usual practice, I’m going to describe the chart from the larger degrees down to the smaller.
Please refer to the lower chart for the first part of the discussion:
Everything we’ve experienced in the market from December 26, 2018 is within wave 5{0} — the Intermediate degree in the traditional nomenclature. That 5th wave has taken the form of an expanding Diagonal Triangle.
Within the triangle, wave 2{-1} was the early pandemic crash and ended on February 23, 2020. The ensuing rise was wave 3{-1}. It ended on January 4, 2022, the date that also marked the beginning of wave 4{-1}.
Under the rules of Elliott wave analysis, this 4th wave won’t move below the start of wave 1{-1}, 2346.589 on December 26, 2018, and will be longer than wave 2{-1}, which ended on December 23, 2020 at 2191.86, after a journey of 1,201.66 points on the index. Also, a 4th wave in an expanding triangle tends to retrace between 66% and 81% of the preceding 3rd wave.
So, this means that the present wave 4{-1}:
- likely will end between 3085.29 to 2691.35 (66% to 81% of wave 3{-1}),
- must end below 3616.34 (longer than wave 2{-1}),
- and won’t end below 2346.58 (not beyond the start of wave 1{-1}).
Please refer to the upper chart for the second part of the discussion:
Since March 29 wave 5{-7} to the downside has been underway. It contains within it three 5th waves that are underway: Wave 5{-8} began on April 21, and wave 5{-9}, on May 30 from 4202.25. When wave 5{-9} is complete, it will also be the end of 5{-8}, 5{-7} and the parent wave one degree higher, wave 1{-6}, which began on January 4.
Wave 1{-6} will be followed by a 2nd wave upward correction that will correct the decline from the January 1 high. Personally, I’ll be looking at that decline as an opportunity to get out of losing positions in anticipation of what will come afterward; that 2nd wave correction will be followed by wave 3{-6} to the downside, setting new lows within the downtrend that began on January 4.
How close is wave 5{-9} to completion? By my count it is now in its middle segment, wave 3{-10}, which will be followed by an upward correction, wave 4{-10}, and then a push further downward, wave 5{-10}, which will trigger completion of parent waves all the way up to wave 1{-6}.
My take-away from this is the certain knowledge that no trend moves in a single direction. A bear market isn’t the simplistic 20% decline metric used by the financial media. Each downtrend contains smaller downtrends and upward corrections, which in turn contain still smaller downtrends and upward corrections. And each correction includes trends and corrections of its own.
So, in Elliott wave terms, we’ve been in a bear market since January 4, and also since May 30, within a years-long bull market, wave 5{-0}, that is taking the form of an expanding Diagonal Triangle.
Bear markets aren’t as simple as the headlines would have us believe.
Regarding the subwaves of wave 5{-9}: I’ve moved the degree labels up one; what was labeled as wave 3{-11} within wave 1{-10} within wave 5{-9} is now labeled wave 3{-10} within wave 5{-9}, bumping the degree up by one.
We Are Here.
These are the waves currently in progress under my principal analysis. Each line on the list shows the wave number, with the subscript in curly brackets, the traditional degree name, the starting date, the starting price of the S&P 500 E-mini futures, and the direction of the wave.
- S&P 500 Index:
- 5{+3} Supercycle, 7/8/1932, 4.40 (up)
- 5{+2} Cycle, 12/9/1974, 60.96 (up)
- 5{+1} Primary, 3/6/2009, 666.79 (up)
- 5{0} Intermediate, 12/26/2018, 2346.58 (up)
- 4{-1} Minor, 1/4/2022 4818.62 (down)
- 1{-2} Minute, 1/4/2022 4818.62 (down)
- S&P 500 Futures and index:
- 1{-3} Minuette, 1/4/2022, 4808.25 (down) (futures), 4818.62 (down) (index)
- S&P 500 Futures:
- 1{-4} Subminuette, 1/4/2022, 4808.25 (down)
- 1{-5} Micro, 1/4/2022, 4808.25 (down)
- 1{-6} Submicro, 1/4/2022, 4808.25 (down)
- 5{-7} Minuscule, 3/29/2022, 4631 (down)
- 5{-8} Subminuscule, 4/21/2022, 4509, (down)
Learning and other resources. Elliott wave analysis provides context, not prophecy. As the 20th century semanticist Alfred Korzybski put it in his book Science and Sanity (1933), “The map is not the territory … The only usefulness of a map depends on similarity of structure between the empirical world and the map.” And I would add, in the ever-changing markets, we can judge that similarity of structure only after the fact.
See the menu page Analytical Methods for a rundown on where to go for information on Elliott wave analysis.
By Tim Bovee, Portland, Oregon, June 14, 2022
Disclaimer
Tim Bovee, Private Trader tracks the analysis and trades of a private trader for his own accounts. Nothing in this blog constitutes a recommendation to buy or sell stocks, options or any other financial instrument. The only purpose of this blog is to provide education and entertainment.
No trader is ever 100 percent successful in his or her trades. Trading in the stock and option markets is risky and uncertain. Each trader must make trading decisions for his or her own account, and take responsibility for the consequences.
License
All content on Tim Bovee, Private Trader by Timothy K. Bovee is licensed under a Creative Commons Attribution-ShareAlike 4.0 International License.
Based on a work at www.timbovee.com.

[…] the larger downtrend that began on May 30, within a series of downtrends of increasing size. See yesterday’s Trader’s Notebook for a description of the larger movements defining this […]
LikeLike