3:30 p.m. New York time
Half an hour before the closing bell. The S&P 500 futures has fallen to the 3640s during the session, below the likely target price of wave B{-12}, 3650.49. Wave B{-12} is the middle of three waves in a Flat corrective pattern. When complete, it will be followed by a rise, wave C{-12}. The parent waves — upward correction wave 4{-11} within downtrending wave 3{-10} within downtrending wave 5{-9} — are stilll undeerway.
No change in the analysis. I’ve updated the chart.
11:05 a.m. New York time
How far down is down? I’ve updated the chart with a dashed line at 3650.49 showing the likely maximum decline of wave B{-12}, the middle segment of the upward correction now underway. Elliott wave theory says that B waves in a Flat pattern tend to retrace 100% to 138% of the preceding A wave, and the price on the futures have almost hit the 138% retracement mark.
9:35 a.m. New York time
What’s happening now? The S&P 500 E-mini futures, having risen 134.5 points on Thursday, resumed its downtrend overnight, falling 148 points from the prior session’s high.
What does it mean? The rise was the first segment of an upward correction within the larger downtrend that began on June 2, and the subsequent decline was the second segment of that correction.
What are the alternatives? The rise completed the upward correction and the final segment of the larger downtrend is underway. I think this is unlikely because the upward movement was uncommonly shallow, retracing only 28% of the decline that began on June 2. I would expect a greater retracement. Yet, this scenario isn’t impossible.
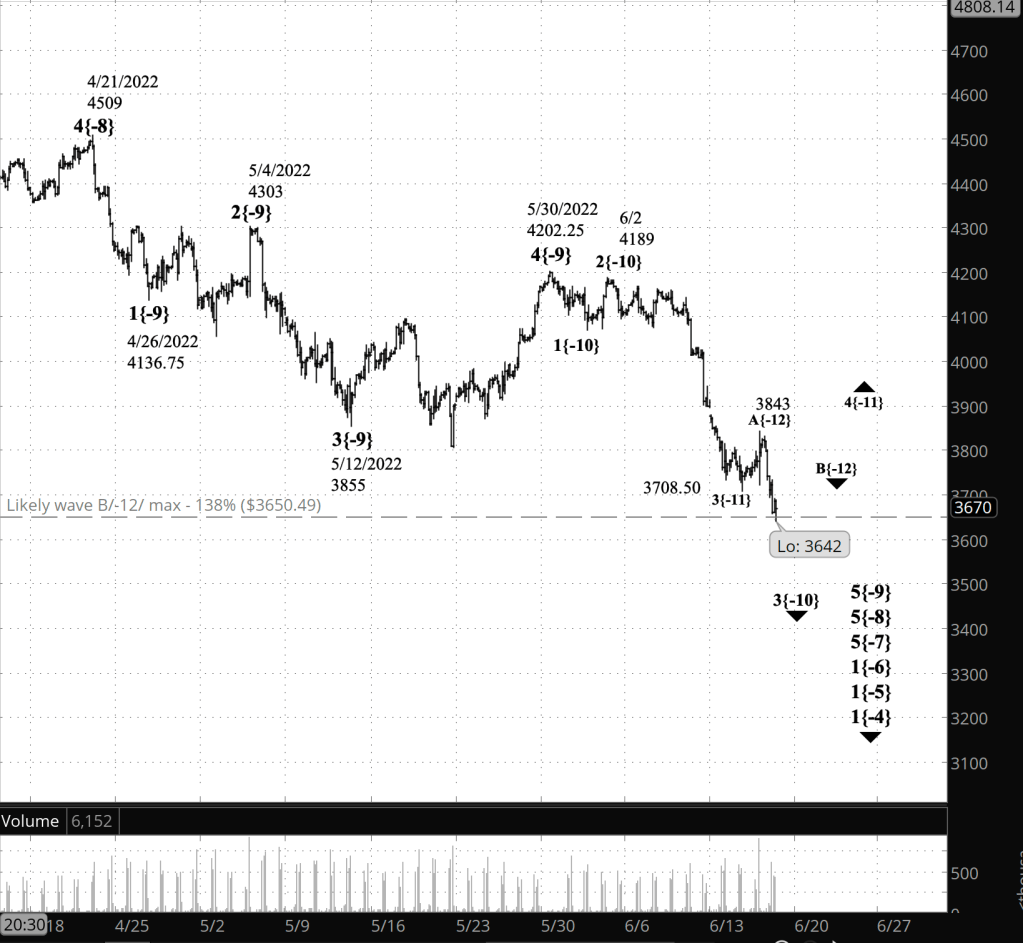
What does Elliott wave theory say? Yesterday’s upward correction is wave 4{-11} within wave 3{-10}, which began on June 2. Fourth waves usually form a Flat pattern, and downward wave B of a Flat can move below the end of the preceding 3rd wave. My principal analysis is based on that scenario. We can expect the B wave to be followed by an upward C wave that will complete the Flat pattern. When wave 4{-11} has reached completion, wave 5{-11} will carry the price down, perhaps by a significant distance, and will complete the parent wave 3{-10}.
The alternative analysis accounts for a scenario in which yesterday’s rise was the entirety of wave 4{-11}, and wave 5{-11} to the downside is now underway. As noted in the Alternative section, I think this scenario is unlikely.
If the price reverses quickly and exceeds yesterday’s high, 3843, the movement will confirm the principal analysis. If the price keeps falling in the five-wave pattern that’s normal for a trend, then the alternative analysis will be confirmed.
This is all happening within downtrending wave 5{-9}, which began on May 30 from 4202.25 and is the final wave within downtrending wave 5{-8}, which began on April 21 from 4509.
We Are Here.
These are the waves currently in progress under my principal analysis. Each line on the list shows the wave number, with the subscript in curly brackets, the traditional degree name, the starting date, the starting price of the S&P 500 E-mini futures, and the direction of the wave.
- S&P 500 Index:
- 5{+3} Supercycle, 7/8/1932, 4.40 (up)
- 5{+2} Cycle, 12/9/1974, 60.96 (up)
- 5{+1} Primary, 3/6/2009, 666.79 (up)
- 5{0} Intermediate, 12/26/2018, 2346.58 (up)
- 4{-1} Minor, 1/4/2022 4818.62 (down)
- 1{-2} Minute, 1/4/2022 4818.62 (down)
- S&P 500 Futures and index:
- 1{-3} Minuette, 1/4/2022, 4808.25 (down) (futures), 4818.62 (down) (index)
- S&P 500 Futures:
- 1{-4} Subminuette, 1/4/2022, 4808.25 (down)
- 1{-5} Micro, 1/4/2022, 4808.25 (down)
- 1{-6} Submicro, 1/4/2022, 4808.25 (down)
- 5{-7} Minuscule, 3/29/2022, 4631 (down)
- 5{-8} Subminuscule, 4/21/2022, 4509, (down)
Learning and other resources. Elliott wave analysis provides context, not prophecy. As the 20th century semanticist Alfred Korzybski put it in his book Science and Sanity (1933), “The map is not the territory … The only usefulness of a map depends on similarity of structure between the empirical world and the map.” And I would add, in the ever-changing markets, we can judge that similarity of structure only after the fact.
See the menu page Analytical Methods for a rundown on where to go for information on Elliott wave analysis.
By Tim Bovee, Portland, Oregon, June 16, 2022
Disclaimer
Tim Bovee, Private Trader tracks the analysis and trades of a private trader for his own accounts. Nothing in this blog constitutes a recommendation to buy or sell stocks, options or any other financial instrument. The only purpose of this blog is to provide education and entertainment.
No trader is ever 100 percent successful in his or her trades. Trading in the stock and option markets is risky and uncertain. Each trader must make trading decisions for his or her own account, and take responsibility for the consequences.
License
All content on Tim Bovee, Private Trader by Timothy K. Bovee is licensed under a Creative Commons Attribution-ShareAlike 4.0 International License.
Based on a work at www.timbovee.com.

You must be logged in to post a comment.