Markets closed on Monday. U.S. markets will be closed on Monday for the Juneteenth holiday. Often the S&P 500 E-mini futures will trade overnight on holidays, and if that’s the case for Juneteenth, then I shall post an analysis in the morning.
3:30 p.m. New York time
Half an hour before the closing bell. The S&P 500 fell during the session, reaching 3639 on the futures before rising slightly. This morning’s alternative analysis is now the new principal analysis: Downward wave B{-12} within an upward correction, wave 4{-11}, is still underway, on the third day after it began. Internally, wave B{-12} is in its 3rd and final leg. I’ve updated the chart.
11:20 a.m. New York time
Alternative analysis proven correct. The S&P 500 fell below Thursday’s low on the futures, 3708.50, to 3639. This validates the alternative analysis: Wave B{-12} to the downside is still underway, and wave C{-12} has not yet begun. I’ve updated the chart, changing the wave labels and removing the wave C{-12} price target lines.
9:35 a.m. New York time
What’s happening now? The S&P 500 E-mini futures reversed to the upside in overnight trading, rising from the mid-3600s back into the upper 3600s.
What does it mean? Yesterday’s low was 8.5 points below the price target for the decline that began on June 15, strengthening the argument that the subsequent rise was the beginning of a small upward correction of the decline that ran from June 2 to June 16. The rise will likely move above the June 15 high of 3843 and could move above 4000.
What are the alternatives? The overnight rise hasn’t gone far, and it’s possible that it is a still smaller correction within the downtrend rather than correcting the June 2 to June 16 decline.
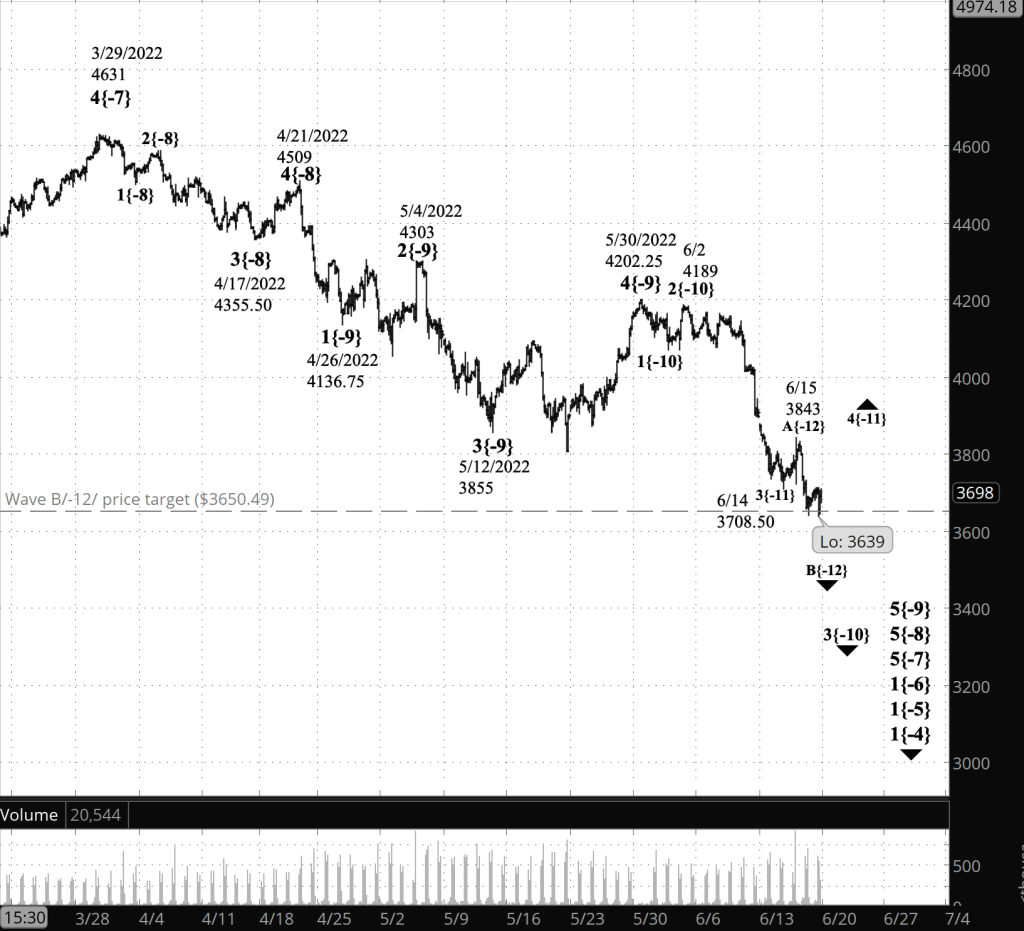
What does Elliott wave theory say? Under the principal analysis, the overnight law was the end of wave B{-12}, the middle wave of a Flat corrective pattern within the parent wave 4{-11}. The subsequent rise is the beginning of wave C{-12}. Under the Elliott wave guidelines, a C wave tends to retrace 100% to 165% of the preceding A wave. Wave A{-12} was 134.50 points long, giving a price target range of 3843 to 4064.93. I’ve marked the C-wave target range on the chart with gray dashed lines. I’ve retained the B-wave target, 3650.49, as a blue dashed line.
Under the alternative analysis, wave B{-12} is still underway, and the overnight rise is the start of wave B{-13}, the middle of three subwaves within B{-12}.
If the price continues to rise, then the principal analysis becomes more likely. If the price falls below 3708.50, then the alternative analysis is correct.
All of this is happening within wave 3{-10} within wave 5{-9}, a subwave of wave 5{-8} within wave 5{-7}, which began on March 29 from 4631.
We Are Here.
These are the waves currently in progress under my principal analysis. Each line on the list shows the wave number, with the subscript in curly brackets, the traditional degree name, the starting date, the starting price of the S&P 500 E-mini futures, and the direction of the wave.
- S&P 500 Index:
- 5{+3} Supercycle, 7/8/1932, 4.40 (up)
- 5{+2} Cycle, 12/9/1974, 60.96 (up)
- 5{+1} Primary, 3/6/2009, 666.79 (up)
- 5{0} Intermediate, 12/26/2018, 2346.58 (up)
- 4{-1} Minor, 1/4/2022 4818.62 (down)
- 1{-2} Minute, 1/4/2022 4818.62 (down)
- S&P 500 Futures and index:
- 1{-3} Minuette, 1/4/2022, 4808.25 (down) (futures), 4818.62 (down) (index)
- S&P 500 Futures:
- 1{-4} Subminuette, 1/4/2022, 4808.25 (down)
- 1{-5} Micro, 1/4/2022, 4808.25 (down)
- 1{-6} Submicro, 1/4/2022, 4808.25 (down)
- 5{-7} Minuscule, 3/29/2022, 4631 (down)
- 5{-8} Subminuscule, 4/21/2022, 4509, (down)
Learning and other resources. Elliott wave analysis provides context, not prophecy. As the 20th century semanticist Alfred Korzybski put it in his book Science and Sanity (1933), “The map is not the territory … The only usefulness of a map depends on similarity of structure between the empirical world and the map.” And I would add, in the ever-changing markets, we can judge that similarity of structure only after the fact.
See the menu page Analytical Methods for a rundown on where to go for information on Elliott wave analysis.
By Tim Bovee, Portland, Oregon, June 17, 2022
Disclaimer
Tim Bovee, Private Trader tracks the analysis and trades of a private trader for his own accounts. Nothing in this blog constitutes a recommendation to buy or sell stocks, options or any other financial instrument. The only purpose of this blog is to provide education and entertainment.
No trader is ever 100 percent successful in his or her trades. Trading in the stock and option markets is risky and uncertain. Each trader must make trading decisions for his or her own account, and take responsibility for the consequences.
License
All content on Tim Bovee, Private Trader by Timothy K. Bovee is licensed under a Creative Commons Attribution-ShareAlike 4.0 International License.
Based on a work at www.timbovee.com.

You must be logged in to post a comment.