5:25 p.m. New York time
What’s happening now? USD/BTC continued the sharp decline that began on on May 31 from 32,455, reaching 20,025 on the Bitcoin futures as evening approached in the eastern United States.
What does it mean? The decline is the final segment of a larger downtrend that began on March 28 from 48,575. When the present decline completes the larger downtrend, it will be followed by an upward correction that likely will carry the price back up to the 25,300s and perhaps as high as the 32,400s. The upward correction will be followed by a resumption of the downtrend that will carry the price back to the low 20,000s and perhaps significantly lower.
What’s the alternative? The big unknown on this chart is timing. The decline from March 28 to the present has taken 81 days. The upward correction that followed could be significantly shorter or longer, and that uncertainty is also true of the decline that will follow the correction.
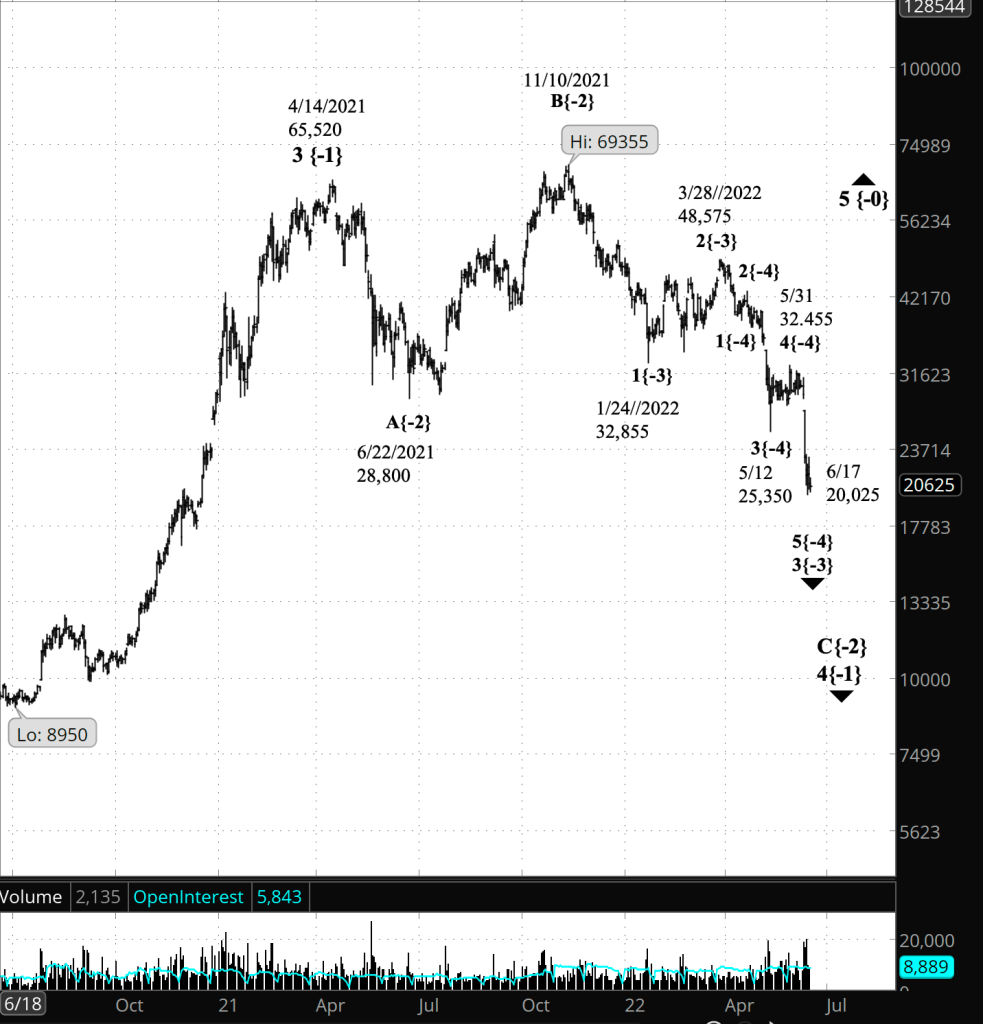
What does Elliott wave theory say? The sharp decline that began on May 31 is downtrending wave 5{-4} within downtrending wave 3{-3}. The 5th wave is the final subwave of the parent 3rd subwave. Fifth waves have no limits. They can be surprisingly short or incredibly long, and every other variant in between. Under the rules of Elliott wave analysis, there’s no way to judge just how bad the losses will be going forward.
The end of wave 5{-4} will also complete wave 3{-3}, which will be followed by an upward correction, wave 4{-4}. Fourth waves tend to form a three-wave Flat pattern. In a Flat, waves A and B each have three subwaves, and wave C has five subwaves.
A 4th wave tends to end in the 4th subwave within the preceding 3rd wave. On the Bitcoin chart that would be wave 4{-4} of wave 3{-3}, which began on May 12 at 25,350 and reached a peak on May 31 of 32,455. I’ve used the hedge-word “tends” because that target price range is a tendency, not a firm rule of Elliott wave theory. Things could go quite differently.
With the beginning of the 4th wave the uncertainties mount. For example, the correction can take different forms, such as a Zigzag or a variety of Triangle, each with its own subwave counts. It can string together two or three corrective patterns, stretching the time taken by the correction.
Long story short: If wave 4{-3} is typical, the largest recovery we an expect will carry the price up to 32,455, more or less.
Looking further ahead, the bad expectation is that wave 4{-3} will be followed by a larger downtrending 5th wave than the present one. Wave 5{-3}, which will carry Bitcoin to new lows.
The good expectation is that the completion of wave 5{-3} will likely mark the end of wave C{-2}, which began on November 10, 2021 from 48,575, and the C wave’s parent, wave 4{-1}, a massive downward correction that began on April 14, 2021 from 65,520.
Note that I’ve used another of those annoying hedge-words, another “likely”. It’s possible that wave 4{-1} will form a compound structure, containing two or three corrective structures.
Wave 4{-1} will be followed by an uptrend, wave 5{-1}, which is likely to carry the price above 65,520, and perhaps significantly higher. As I noted earlier in this discussion, 5th waves sometimes come up short — “truncation” in the terminology of Elliott wave analysis. If this should happen, then wave 5{-1} will end below 65,520.
Bottom line: The present decline will be followed by a rise, but it is likely to be shallow, perhaps reaching only the low 32,000s. It will be followed by a soul-crushing decline that will burn any optimism out of the Bitcoin market. But if the rules of Elliott wave analysis hold true, ultimately, almost certainly years down the road, Bitcoin will recover.
We Are Here.
These are the waves currently in progress under my principal analysis. Each line on the list shows the wave number, with the subscript in curly brackets, the traditional degree name, the starting date, the starting price of the S&P 500 E-mini futures, and the direction of the wave.
- Futures:
- 5{0} Intermediate, 12/14/2018, 3,120 (up)
- 4{-1} Minor, 4/14/2021, 65,520 (down)
- C{-2} Minute, 11/10/2021, 69,355 (down)
- 3{-3} Minuette, 3/28/2022, 46,550 (down)
Learning and other resources. Elliott wave analysis provides context, not prophecy. As the 20th century semanticist Alfred Korzybski put it in his book Science and Sanity (1933), “The map is not the territory … The only usefulness of a map depends on similarity of structure between the empirical world and the map.” And I would add, in the ever-changing markets, we can judge that similarity of structure only after the fact.
See the menu page Analytical Methods for a rundown on where to go for information on Elliott wave analysis.
By Tim Bovee, Portland, Oregon, June 17, 2022
Disclaimer
Tim Bovee, Private Trader tracks the analysis and trades of a private trader for his own accounts. Nothing in this blog constitutes a recommendation to buy or sell stocks, options or any other financial instrument. The only purpose of this blog is to provide education and entertainment.
No trader is ever 100 percent successful in his or her trades. Trading in the stock and option markets is risky and uncertain. Each trader must make trading decisions for his or her own account, and take responsibility for the consequences.
License
All content on Tim Bovee, Private Trader by Timothy K. Bovee is licensed under a Creative Commons Attribution-ShareAlike 4.0 International License.
Based on a work at www.timbovee.com.

You must be logged in to post a comment.