10:50 a.m. New York time
What’s happening now? The S&P 500 E-mini futures traded in a narrow range during overnight trading and into the Juneteenth holiday in the United States. U.S. stock and bond markets are closed for the holiday. The price has fluctuated narrowly so far, with a range covering slightly less than 50 points.
What does it mean? The declining middle leg of a short-term upward correction that began on June 14 is underway. It will be followed by a rising final wave that will complete the corrective pattern — a Flat — and most likely the entire correction. Afterward, the downtrend that began on June 2 will resume.
What are the alternatives? As usual, there’s a bit of ambiguity in where each movement fits within the fractal structure of market movements. Lower degree? Higher degree? It’s often hard to say. So Friday’s low, 3639, could well mark the end of the middle leg of the correction. A strong push to the upside will increase the odds that the final leg is underway.
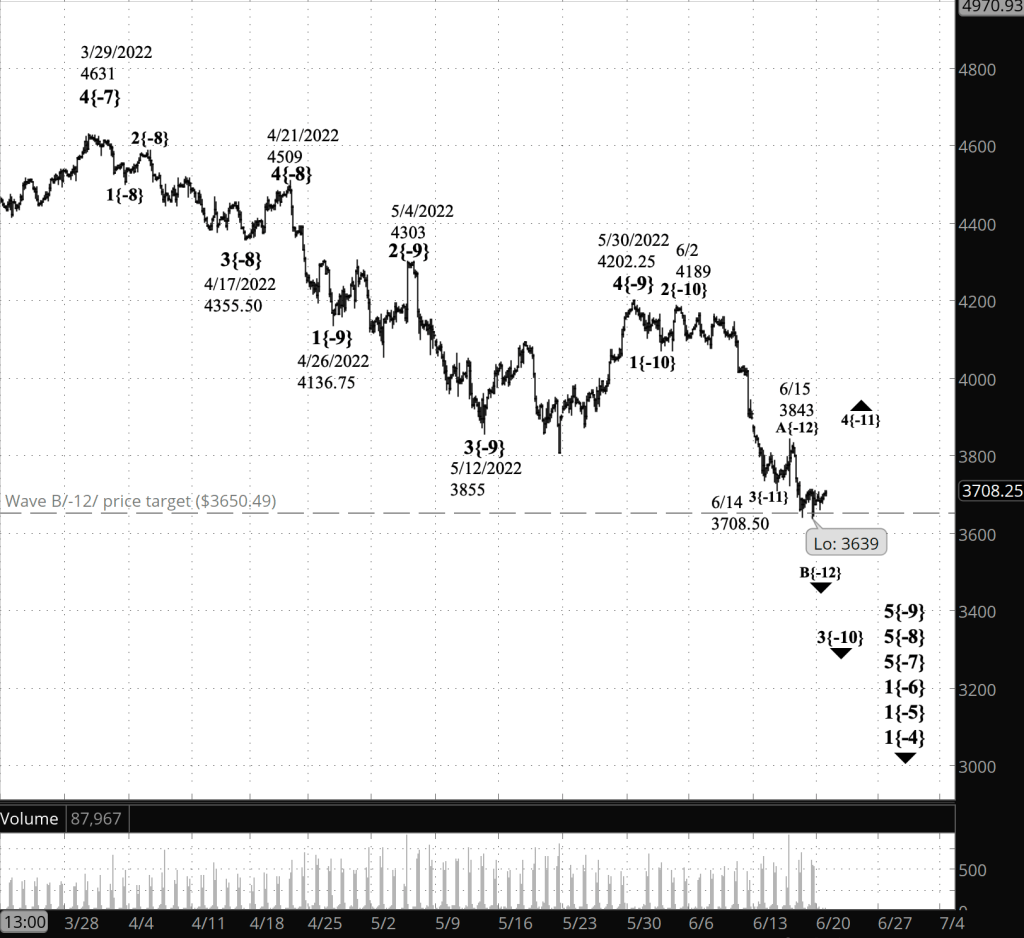
What does Elliott wave theory say? The correction is wave 4{-11} within wave 3{-10}. The decline that began on June 15 from 3843 is wave B{-12} within that 4th wave Flat correction. Wave B{-12} will be followed by wave C{-12} to the upside. C waves typically are 100% to 165% as long as the preceding A wave, which covered 134.5 points.
This is all happening within wave 5{-9}, which began on May 30 from 42.02.25; within wave 5{-8}, which began on April 21 from 4509; within wave 5{-7}, which began on March 29 from 4631. All of those parent waves are downtrending.
We Are Here.
These are the waves currently in progress under my principal analysis. Each line on the list shows the wave number, with the subscript in curly brackets, the traditional degree name, the starting date, the starting price of the S&P 500 E-mini futures, and the direction of the wave.
- S&P 500 Index:
- 5{+3} Supercycle, 7/8/1932, 4.40 (up)
- 5{+2} Cycle, 12/9/1974, 60.96 (up)
- 5{+1} Primary, 3/6/2009, 666.79 (up)
- 5{0} Intermediate, 12/26/2018, 2346.58 (up)
- 4{-1} Minor, 1/4/2022 4818.62 (down)
- 1{-2} Minute, 1/4/2022 4818.62 (down)
- S&P 500 Futures and index:
- 1{-3} Minuette, 1/4/2022, 4808.25 (down) (futures), 4818.62 (down) (index)
- S&P 500 Futures:
- 1{-4} Subminuette, 1/4/2022, 4808.25 (down)
- 1{-5} Micro, 1/4/2022, 4808.25 (down)
- 1{-6} Submicro, 1/4/2022, 4808.25 (down)
- 5{-7} Minuscule, 3/29/2022, 4631 (down)
- 5{-8} Subminuscule, 4/21/2022, 4509, (down)
Learning and other resources. Elliott wave analysis provides context, not prophecy. As the 20th century semanticist Alfred Korzybski put it in his book Science and Sanity (1933), “The map is not the territory … The only usefulness of a map depends on similarity of structure between the empirical world and the map.” And I would add, in the ever-changing markets, we can judge that similarity of structure only after the fact.
See the menu page Analytical Methods for a rundown on where to go for information on Elliott wave analysis.
By Tim Bovee, Portland, Oregon, June 20, 2022
Disclaimer
Tim Bovee, Private Trader tracks the analysis and trades of a private trader for his own accounts. Nothing in this blog constitutes a recommendation to buy or sell stocks, options or any other financial instrument. The only purpose of this blog is to provide education and entertainment.
No trader is ever 100 percent successful in his or her trades. Trading in the stock and option markets is risky and uncertain. Each trader must make trading decisions for his or her own account, and take responsibility for the consequences.
License
All content on Tim Bovee, Private Trader by Timothy K. Bovee is licensed under a Creative Commons Attribution-ShareAlike 4.0 International License.
Based on a work at www.timbovee.com.

You must be logged in to post a comment.