3:30 p.m. New York time
Half an hour before the closing bell. The S&P 500 has risen during the session, returning to the upper 3700s on the futures. The rise can be counted as wave 5{-13}, the final wave within wave C{-12}, which in turn is the final wave within the wave 4{-11} upward correction, which began on June 14. I’ve updated the chart.
9:35 a.m. New York time
What’s happening now? The S&P 500 E-mini futures fell in overnight trading, returning to the low 3700s.
What does it mean? The downward movement is the fourth of five segments within the final rise of an upward correction that began on June 14. When that final rise is complete, the downtrend that began on June 2 from 4189 likely will resume, unless the correction forms a compound structure linking several corrective patterns together.
What is the alternative? The upward correction is small in comparison with the larger downtrend that it is correcting. That raises the possibility that the correction is of a lower degree than I’ve it on the chart.
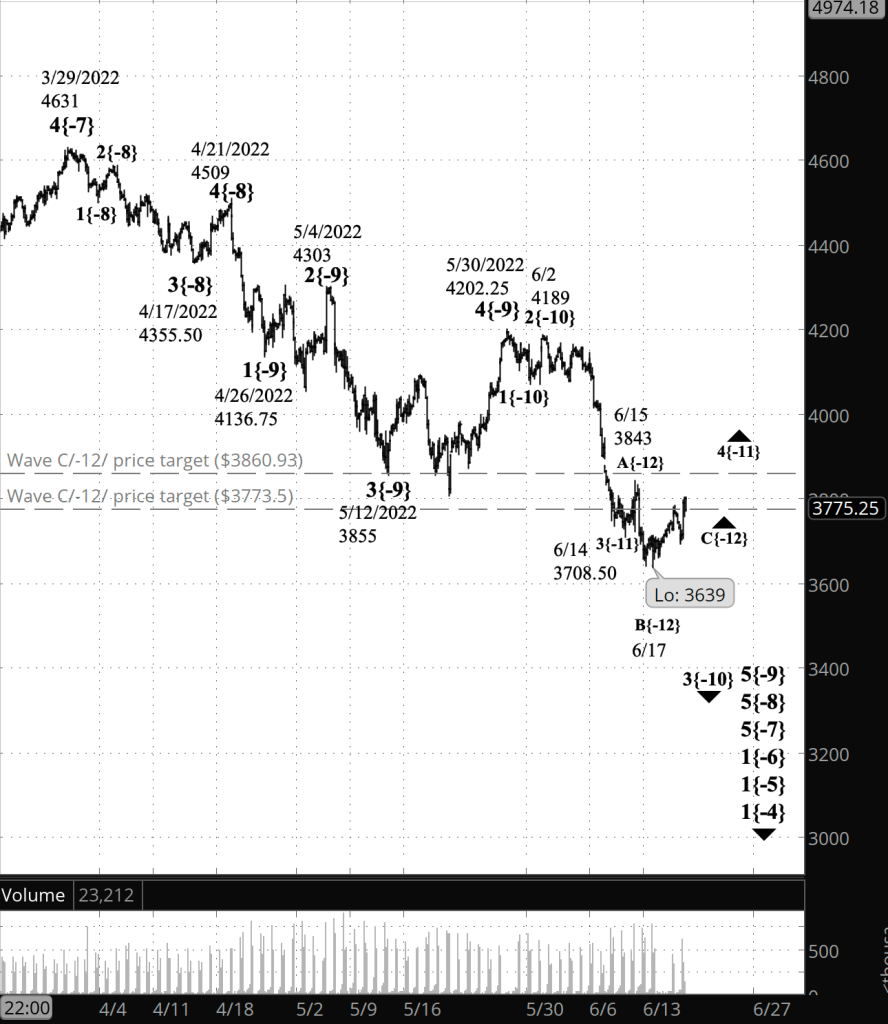
What does Elliott wave theory say? The upward correction is wave 4{-11} within a downtrend, wave 3{-10}. Within the 4th wave, the last of three waves, C{-12}, is underway. The C wave will have five internal waves. By my principal count, the 5th wave — wave 5{-13} — is now in progress.
Wave 4{-13} will be followed by the final wave in the corrective pattern, rising wave 5{-13}, whose end point will also mark the end of the parent, wave C{-12}, and perhaps of the upward correction, wave 4{-11}. I’m hedging the end point of wave 4{-11} because it’s possible that the correction will form a compound structure, containing two or three corrective patterns, each separated by a connector, wave X.
In any case, once wave 4{-11} is complete, wave 5{-11} will begin, a downtrending wave that is the final segment of wave 3{-10}, a downtrend that began on June 2.
My alternative analysis recognizes the possibility that what I’ve called wave 4{-11} is actually one degree small, wave 4{-12}. The A wave within 4{-11} is only 134.50 points long, and the entire upward correction so far is only 204 points long — low to high. By contrast, the preceding downtrending wave, 3{-10}, is 481 points long from its starting point to the presumed start of wave 4{-11}. It doesn’t break any rule of Elliott wave analysis, but it’s a weak correction.
On the other hand, the high point of 4{-11} so far is within the 4th subwave of wave 3{-11}, which precedes it, and that’s one of the tendencies of 4th waves identified in Elliott wave theory.
All of this is happening within wave 5{-9}, which began on May 30, within wave 5{-8}, beginning on April 21, within 5{-7}, beginning on March 29, within wave 1{-6}, which began on January 4.
We Are Here.
These are the waves currently in progress under my principal analysis. Each line on the list shows the wave number, with the subscript in curly brackets, the traditional degree name, the starting date, the starting price of the S&P 500 E-mini futures, and the direction of the wave.
- S&P 500 Index:
- 5{+3} Supercycle, 7/8/1932, 4.40 (up)
- 5{+2} Cycle, 12/9/1974, 60.96 (up)
- 5{+1} Primary, 3/6/2009, 666.79 (up)
- 5{0} Intermediate, 12/26/2018, 2346.58 (up)
- 4{-1} Minor, 1/4/2022 4818.62 (down)
- 1{-2} Minute, 1/4/2022 4818.62 (down)
- S&P 500 Futures and index:
- 1{-3} Minuette, 1/4/2022, 4808.25 (down) (futures), 4818.62 (down) (index)
- S&P 500 Futures:
- 1{-4} Subminuette, 1/4/2022, 4808.25 (down)
- 1{-5} Micro, 1/4/2022, 4808.25 (down)
- 1{-6} Submicro, 1/4/2022, 4808.25 (down)
- 5{-7} Minuscule, 3/29/2022, 4631 (down)
- 5{-8} Subminuscule, 4/21/2022, 4509, (down)
Learning and other resources. Elliott wave analysis provides context, not prophecy. As the 20th century semanticist Alfred Korzybski put it in his book Science and Sanity (1933), “The map is not the territory … The only usefulness of a map depends on similarity of structure between the empirical world and the map.” And I would add, in the ever-changing markets, we can judge that similarity of structure only after the fact.
See the menu page Analytical Methods for a rundown on where to go for information on Elliott wave analysis.
By Tim Bovee, Portland, Oregon, June 22, 2022
Disclaimer
Tim Bovee, Private Trader tracks the analysis and trades of a private trader for his own accounts. Nothing in this blog constitutes a recommendation to buy or sell stocks, options or any other financial instrument. The only purpose of this blog is to provide education and entertainment.
No trader is ever 100 percent successful in his or her trades. Trading in the stock and option markets is risky and uncertain. Each trader must make trading decisions for his or her own account, and take responsibility for the consequences.
License
All content on Tim Bovee, Private Trader by Timothy K. Bovee is licensed under a Creative Commons Attribution-ShareAlike 4.0 International License.
Based on a work at www.timbovee.com.

You must be logged in to post a comment.