3:30 p.m. New York time
Half an hour before the closing bell. The S&P 500 traded within a narrow range in the upper 3700s during the session, remaining in the neighborhood of the lower boundary of the target price range for the rise that began on June 17. Wave C{-12} within an upward correction, wave 4{-11}, is still underway. I’ve updated the chart.
12:40 p.m. New York time
FDX earnings play entry. I’ve entered a short bull put vertical spread on FDX, using options that trade for the last time on July 15, and have posted an analysis of the trade.
9:35 a.m. New York time
What’s happening now? The S&P 500 E-mini futures fell and rose again in overnight trading, staying within a fairly narrow range at the lower boundary of the target price range of the rise that began on June 17. The target range is marked on the chart by dashed lines.
What does it mean? The third and likely final segment of the upward correction that began on June 14 is still underway. Internally, the segment will have five subwaves and is now nearing completion the 3rd wave.
What are the alternatives? There are two.
Alternative #1: It’s possible that yesterday’s peak, 3805.50, was the end of the correction and the subsequent decline, the resumption of the downtrend that began on June 2.
Alternative #2: Or, 3805.50 may have ended the first three-wave corrective pattern within a compound correction, which strings together two or three corrective patterns.
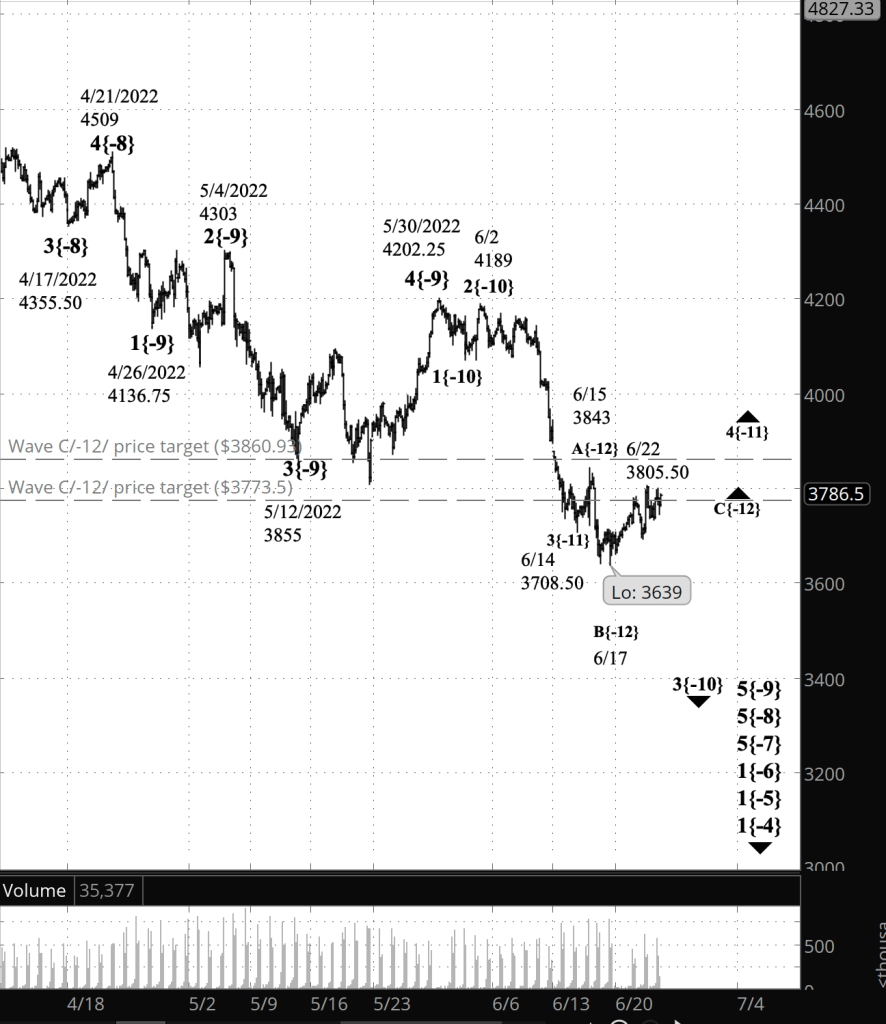
What does Elliott wave theory say? Under the principal analysis, yesterday’s peak, 3805.50, is the end of wave 5{-14} within wave 3{-13} within the third segment, C{-12}, of the upward correction, 4{-11} that began on June 14. The subsequent decline is part of wave 4{-13}.
Under the first alternative analysis, yesterday’s high is the end of the upward correction, wave 4{-11}, and the subsequent decline is a first tentative step in wave 5{-11}, which resumes the downtrend.
Under the second alternative analysis, wave 4{-11} is forming a compound structure. Yesterday’s high ended wave C{-12}, but the the parent, wave 4{-11}, is still underway. The decline off of that high is the beginning of wave X{-12}, connecting the first corrective pattern with a second one that is yet to come.
Whichever scenario plays out, when wave 5{-11} ends, it will also mark the end of the larger downtrending wave 3{-10}, which began on June 2, within wave 5{-9}, which began on May 30. When wave 3{-10} is complete, it will be followed by an upward correction, wave 4{-10}, which will be larger than the present wave 4{-11} upward correction.
We Are Here.
These are the waves currently in progress under my principal analysis. Each line on the list shows the wave number, with the subscript in curly brackets, the traditional degree name, the starting date, the starting price of the S&P 500 E-mini futures, and the direction of the wave.
- S&P 500 Index:
- 5{+3} Supercycle, 7/8/1932, 4.40 (up)
- 5{+2} Cycle, 12/9/1974, 60.96 (up)
- 5{+1} Primary, 3/6/2009, 666.79 (up)
- 5{0} Intermediate, 12/26/2018, 2346.58 (up)
- 4{-1} Minor, 1/4/2022 4818.62 (down)
- 1{-2} Minute, 1/4/2022 4818.62 (down)
- S&P 500 Futures and index:
- 1{-3} Minuette, 1/4/2022, 4808.25 (down) (futures), 4818.62 (down) (index)
- S&P 500 Futures:
- 1{-4} Subminuette, 1/4/2022, 4808.25 (down)
- 1{-5} Micro, 1/4/2022, 4808.25 (down)
- 1{-6} Submicro, 1/4/2022, 4808.25 (down)
- 5{-7} Minuscule, 3/29/2022, 4631 (down)
- 5{-8} Subminuscule, 4/21/2022, 4509, (down)
Learning and other resources. Elliott wave analysis provides context, not prophecy. As the 20th century semanticist Alfred Korzybski put it in his book Science and Sanity (1933), “The map is not the territory … The only usefulness of a map depends on similarity of structure between the empirical world and the map.” And I would add, in the ever-changing markets, we can judge that similarity of structure only after the fact.
See the menu page Analytical Methods for a rundown on where to go for information on Elliott wave analysis.
By Tim Bovee, Portland, Oregon, June 23, 2022
Disclaimer
Tim Bovee, Private Trader tracks the analysis and trades of a private trader for his own accounts. Nothing in this blog constitutes a recommendation to buy or sell stocks, options or any other financial instrument. The only purpose of this blog is to provide education and entertainment.
No trader is ever 100 percent successful in his or her trades. Trading in the stock and option markets is risky and uncertain. Each trader must make trading decisions for his or her own account, and take responsibility for the consequences.
License
All content on Tim Bovee, Private Trader by Timothy K. Bovee is licensed under a Creative Commons Attribution-ShareAlike 4.0 International License.
Based on a work at www.timbovee.com.

You must be logged in to post a comment.