3:30 p.m. New York time
Half an hour before the closing bell. The S&P 500 has traded in a narrow range during the session, keeping to the low- and mid-3800s on the futures. No change in the analysis. I’ve updated the chart.
10:50 a.m. New York time
WBA earnings play entry. I’ve entered a short bear call vertical spread on WBA, using options that trade for the last time on August 19, and have posted a trade analysis.
9:35 a.m. New York time
What’s happening now? The S&P 500 E-mini futures fell in overnight trading, pausing in the low 3800s.
What does it mean? The sharp decline is a resumption of the downtrend that began on June 2 and is the downtrend’s final leg. The downtrend resumed following the end of preceding upward correction, on June 28 at 3950
What are the alternatives? There are two.
Alternative #1: The decline is an internal movement within the third leg of the upward correction, which is still underway.
Alternative #2: The upward correction is taking a compound form, and the decline will connect the first corrective pattern with a second corrective pattern to come.
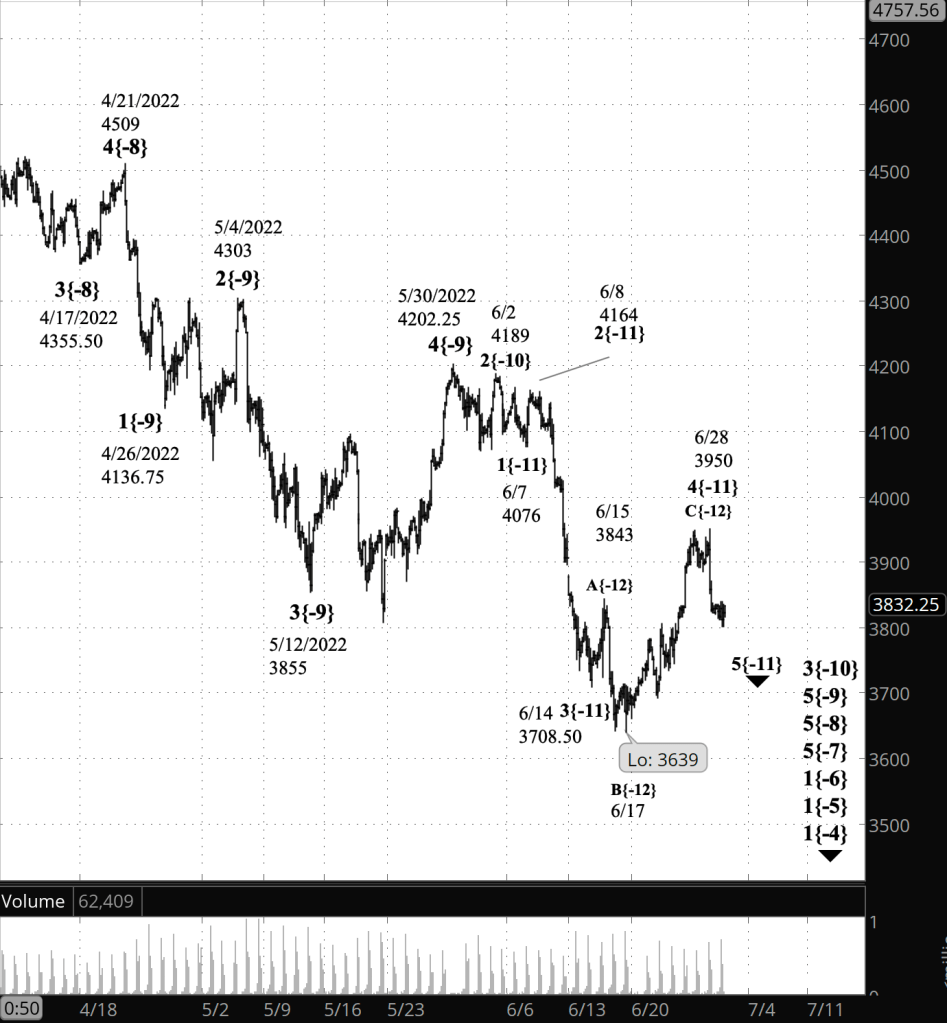
What does Elliott wave theory say? Under the principal analysis, the upward correction, wave 4{-11}, ended on June 28, and the ensuing wave 5{-11} resumes the downtrend, wave 3{-10}, that began on June 2.
Under the first alternative analysis, wave 4{-11} is still underway, and the decline is a subwave of the corrective pattern’s third and final wave, C{-12}.
Under the second alternative analysis, wave 4{-11} is forming a compound correction. Wave C{-12} ended on June 28, wrapping up the first corrective pattern. The ensuing decline is a connector, wave X{-12}, which will be followed by a second corrective pattern within wave 4{-11}.
In any case, the end of wave 4{-11} is followed by wave 5{-11}, a resumption of the downtrend that began on June 2.
A 5th wave has no rules limiting how far down it can go, although it must fit in reasonably with other waves a similar degree. A move below the start of wave 4{-11}, from 3708.50 on June 14, will strengthen the case that the 5th wave is underway. If the decline ends up with five waves internally, that will confirm that the decline is wave 5{-11} .
If the decline ends up with three waves internally, then the second alternative is confirmed. The decline is wave X{-12}, a connector wave in a compound correction.
If the decline reverses from the present level and moves above the June 28 high of 3950, then wave C{-12} within wave 4{-11} is still underway.
Whichever scenario plays out, wave 5{-11} when complete, will also mark the end of wave 3{-10} and the beginning of a significant upward correction, wave 4{-10}. A 4th wave tends to retrace between 66% and 81% of the preceding 3rd wave, which at a minimum will cover 480.5 points, and will perhaps move much further. So I expect wave 4{-10} to give the S&P 500 a significant boost to the upside from the end of wave 3{-10} before the following wave 5{-10} carries the price further down into the cellar.
We Are Here.
These are the waves currently in progress under my principal analysis. Each line on the list shows the wave number, with the subscript in curly brackets, the traditional degree name, the starting date, the starting price of the S&P 500 E-mini futures, and the direction of the wave.
- S&P 500 Index:
- 5{+3} Supercycle, 7/8/1932, 4.40 (up)
- 5{+2} Cycle, 12/9/1974, 60.96 (up)
- 5{+1} Primary, 3/6/2009, 666.79 (up)
- 5{0} Intermediate, 12/26/2018, 2346.58 (up)
- 4{-1} Minor, 1/4/2022 4818.62 (down)
- 1{-2} Minute, 1/4/2022 4818.62 (down)
- S&P 500 Futures and index:
- 1{-3} Minuette, 1/4/2022, 4808.25 (down) (futures), 4818.62 (down) (index)
- S&P 500 Futures:
- 1{-4} Subminuette, 1/4/2022, 4808.25 (down)
- 1{-5} Micro, 1/4/2022, 4808.25 (down)
- 1{-6} Submicro, 1/4/2022, 4808.25 (down)
- 5{-7} Minuscule, 3/29/2022, 4631 (down)
- 5{-8} Subminuscule, 4/21/2022, 4509, (down)
Learning and other resources. Elliott wave analysis provides context, not prophecy. As the 20th century semanticist Alfred Korzybski put it in his book Science and Sanity (1933), “The map is not the territory … The only usefulness of a map depends on similarity of structure between the empirical world and the map.” And I would add, in the ever-changing markets, we can judge that similarity of structure only after the fact.
See the menu page Analytical Methods for a rundown on where to go for information on Elliott wave analysis.
By Tim Bovee, Portland, Oregon, June 29, 2022
Disclaimer
Tim Bovee, Private Trader tracks the analysis and trades of a private trader for his own accounts. Nothing in this blog constitutes a recommendation to buy or sell stocks, options or any other financial instrument. The only purpose of this blog is to provide education and entertainment.
No trader is ever 100 percent successful in his or her trades. Trading in the stock and option markets is risky and uncertain. Each trader must make trading decisions for his or her own account, and take responsibility for the consequences.
License
All content on Tim Bovee, Private Trader by Timothy K. Bovee is licensed under a Creative Commons Attribution-ShareAlike 4.0 International License.
Based on a work at www.timbovee.com.

You must be logged in to post a comment.