3:30 p.m. New York time
Half an hour before the closing bell. The S&P 500 peaked today, nine minutes after the opening bell, at 3950 on the futures, and began a sharp decline that so far has carried the price down to the low 3800s.
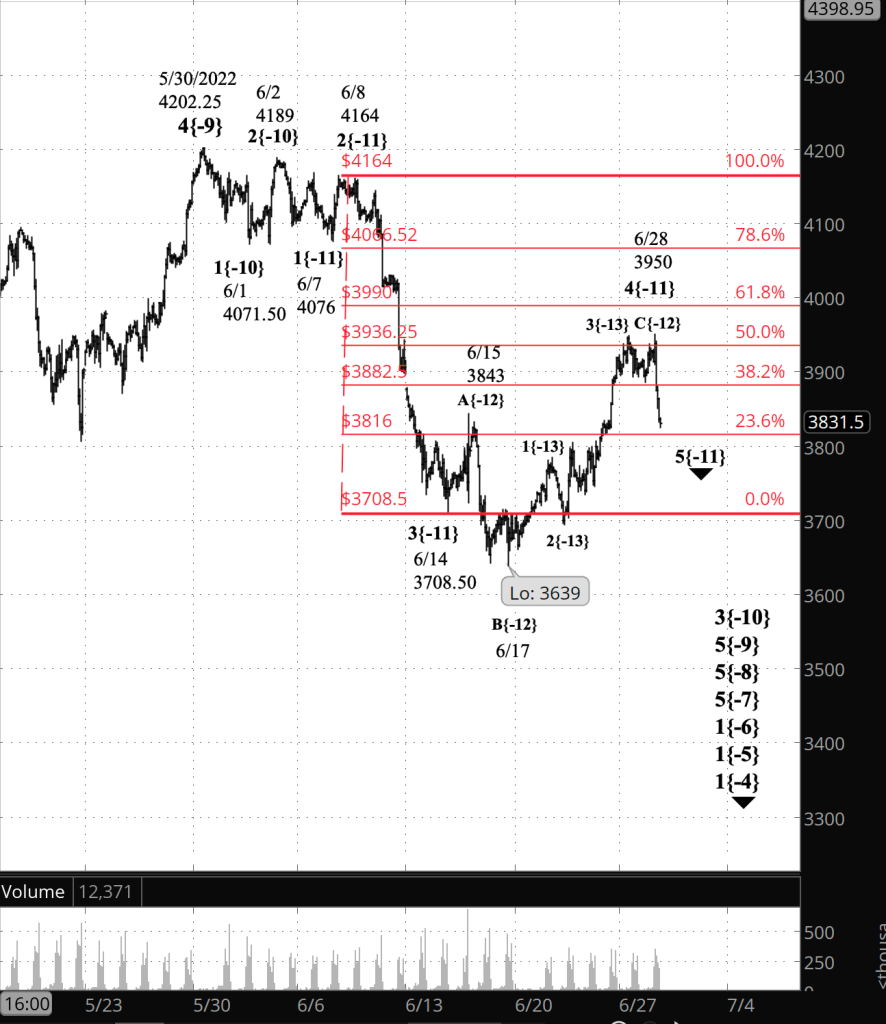
Under my revised principal analysis, the last leg of the upward correction that began on June 14 ended at today’s high, also bringing the upward correction to an end. The subsequent decline is a resumption of the downtrend that began on June 2. Rising wave C{-12} and the upward correction, wave 4{-11}, have ended, and downtrending wave 5{-11} has begun.
Under my first alternative analysis, today’s high is the end of a subwave of rising wave C{-12}, the last leg of the upward correction, wave 4{-11}, which is still underway.
Under my second alternative analysis, today’s high ended the first corrective pattern within a compound correction. Wave C{-12} has ended, and the subsequent decline is a connector wave, X{-12}, which is still underway, all happening within wave 4{-11}.
Bottom line: There is a lot of ambiguity at this point. I see close to equal likelihoods for the principal analysis and either of the alternatives. The velocity of today’s decline persuaded me to choose as the principal analysis the scenario that says that the upward correction has ended and the downtrend has resumed. That could change in the days to come.
I’ve added a new chart so as to allow comparison with this morning’s now outdated analysis.
10:10 a.m. New York time
NKE earnings play exit. I exited my bear call spread on NKE for 37% of maximum potential profit and have updated the trade analysis with full results.
9:35 a.m. New York time
What’s happening now? The S&P 500 E-mini futures fell in overnight trading and then reversed, so far remaining below yesterday’s high, 3948.
What does it mean? The upward correction that began on June 14 continues and most likely is in its final leg. The correction will be followed by a decline that is likely to carry the price into the mid-3600s or lower.
What are the alternatives? If the correction forms a compound structure, connecting two or three corrective patterns, then the last leg of the present corrective pattern will be followed by a connector wave, and then a second corrective pattern. Altogether, compound corrections can link together up to three corrective patterns. After the compound correction is over, a decline will carry the price into the mid-3600s or lower.
The Chart. I’ve superimposed a Fibonacci retracement ladder in red, showing the Fibonacci levels of the upward correction’s retracement of the prior downtrend, which began on June 8 from 4164. Yesterday’s high was slightly above the 50% retracement level, and the overnight decline brought the price close to the 38.2% retracement level. The Fibonacci levels above yesterday’s high is the 61.8% level, at 3990, and 78.6%, at 4066.52. Either would be a reasonable ending point for the upward correction now underway.
(3:30 p.m. New York time: Note that the chart below has been outdated by the day’s developments. See the revised analysis and a new chart, above.)
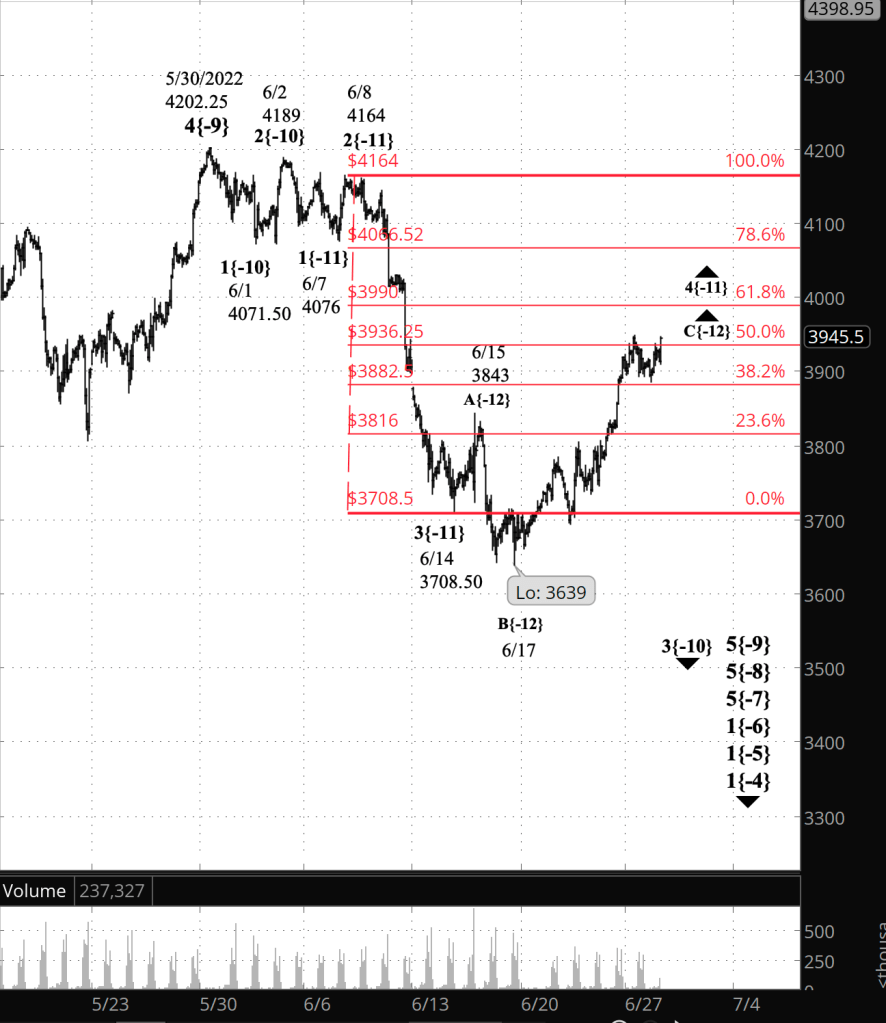
What does Elliott wave theory say? The upward correction is wave 4{-11}, and the corrective pattern is in its 3rd and perhaps final wave, C{-12}.
If wave 4{-11} forms a simple correction, then wave C{-12} will be the end of the upward correction and the start of wave 5{-11}, a resumption of the downtrend that began on June 2, wave 3{-10}. If wave 4{-11} forms a compound correction, then wave C{-12} will be followed by a connector wave, X{-12}, and then a second corrective pattern, most likely consisting of three subwaves.
How high can wave 4{-11} rise? Under the rules of Elliott wave analysis, a 4th wave can’t move beyond the end of the preceding 1st wave. In this case, wave 1{-11} ended at 4076 on June 7. If the price within wave 4{-11} rises above that level, then the count no longer matches the chart and will require a reanalysis. On the chart, the end of wave 1{-11} is 29 points plus change above the 78.6% Fibonacci retracement level.
Once the correction is complete, whether compound or simple, wave 5{-11} will begin, resuming the wave 3{-10} downtrend that began on June 2. There is no limit on how far a 5th wave can travel, beyond the need, under the rule of proportionality, for the distance traveled to be consistent with other waves of the same degree. Wave 5{-11}, when complete, will mark the end of the parent, wave 3{-10}, and will be followed by an upward correction, wave 4{-10}, which is one degree larger than the present correction.
This is all happening within wave 5{-9}, which began on May 30 from 4202.25, and its ancestors, wave 5{-8}, which began on April 21 from 4509, and wave 5{-7}, which began on March 29 from 4631. The parent of them all is wave 1{-6}, which began on January 4 from 4808.25, the start of a major downtrend.
We Are Here.
These are the waves currently in progress under my principal analysis. Each line on the list shows the wave number, with the subscript in curly brackets, the traditional degree name, the starting date, the starting price of the S&P 500 E-mini futures, and the direction of the wave.
- S&P 500 Index:
- 5{+3} Supercycle, 7/8/1932, 4.40 (up)
- 5{+2} Cycle, 12/9/1974, 60.96 (up)
- 5{+1} Primary, 3/6/2009, 666.79 (up)
- 5{0} Intermediate, 12/26/2018, 2346.58 (up)
- 4{-1} Minor, 1/4/2022 4818.62 (down)
- 1{-2} Minute, 1/4/2022 4818.62 (down)
- S&P 500 Futures and index:
- 1{-3} Minuette, 1/4/2022, 4808.25 (down) (futures), 4818.62 (down) (index)
- S&P 500 Futures:
- 1{-4} Subminuette, 1/4/2022, 4808.25 (down)
- 1{-5} Micro, 1/4/2022, 4808.25 (down)
- 1{-6} Submicro, 1/4/2022, 4808.25 (down)
- 5{-7} Minuscule, 3/29/2022, 4631 (down)
- 5{-8} Subminuscule, 4/21/2022, 4509, (down)
Learning and other resources. Elliott wave analysis provides context, not prophecy. As the 20th century semanticist Alfred Korzybski put it in his book Science and Sanity (1933), “The map is not the territory … The only usefulness of a map depends on similarity of structure between the empirical world and the map.” And I would add, in the ever-changing markets, we can judge that similarity of structure only after the fact.
See the menu page Analytical Methods for a rundown on where to go for information on Elliott wave analysis.
By Tim Bovee, Portland, Oregon, June 28, 2022
Disclaimer
Tim Bovee, Private Trader tracks the analysis and trades of a private trader for his own accounts. Nothing in this blog constitutes a recommendation to buy or sell stocks, options or any other financial instrument. The only purpose of this blog is to provide education and entertainment.
No trader is ever 100 percent successful in his or her trades. Trading in the stock and option markets is risky and uncertain. Each trader must make trading decisions for his or her own account, and take responsibility for the consequences.
License
All content on Tim Bovee, Private Trader by Timothy K. Bovee is licensed under a Creative Commons Attribution-ShareAlike 4.0 International License.
Based on a work at www.timbovee.com.

You must be logged in to post a comment.