Market holiday on Monday. U.S. markets will be closed on Monday for a holiday celebrating America’s winning its independence from the British Empire. Trading will resume on Tuesday. The S&P 500 E-mini futures usually resume trading the day before the post-holiday trading session. I’ll keep an eye out for that on Monday and, if events warrant, will post an analysis.
3:30 p.m. New York time
Half an hour before the closing bell. The S&P 500 has continued trading within a narrow range, reaching into the low 3800s and remaining above yesterday’s low on the futures, 3741.25. Downtrending wave 5{-11} continues, having paused for a small internal upward correction. No change in the analysis. I’ve updated the chart.
9:45 a.m. New York time
MU earnings play exit. I’ve exited my short bear call vertical spread on MU for 26.7% of maximum potential profit and have updated the trade analysis with full results.
9:35 a.m. New York time
What’s happening now? The S&P 500 E-mini futures traded in a narrow range overnight, remaining above yesterday’s low, 3741.25.
What does it mean? The downtrend that began on June 28 continues.
What is the alternative? The upward correction that began on June 14 could still be underway, and if so, then the downward movement from June 28 would be a connecting wave within a compound structure, that strings together two or three corrective patterns.
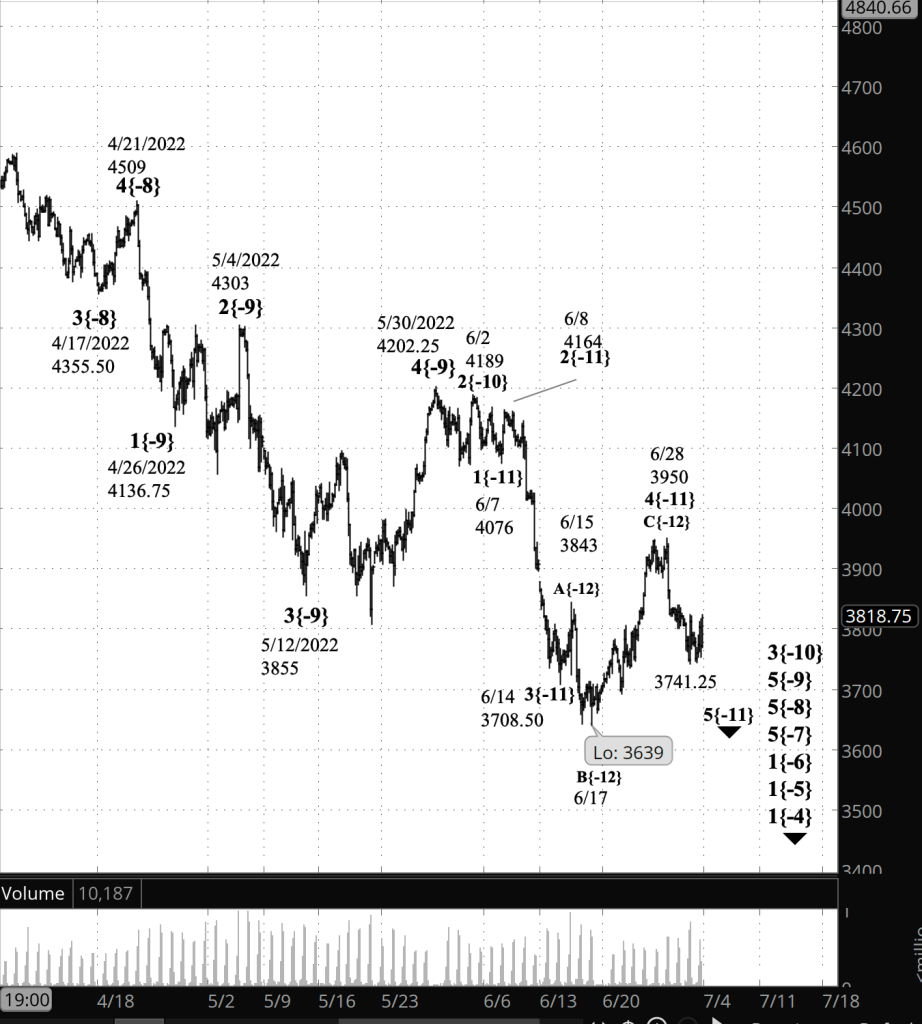
What does Elliott wave theory say? Under the principal analysis, downtrending wave 5{-11} is underway. Its completion will also mark the end of its parent, wave 3{-10}, which began on June 6 from 4189. An upward correction, wave 4{-10}, will follow the 3rd wave, with 4189, the starting point of wave 3{-10} being the upper limit of how far the 4th wave correction can go. It could, of course, travel far less than that distance.
Under the alternative analysis, wave 4{-11}, an upward correction that began on June 14, is forming a compound structure. The first corrective pattern ended on June 28 with wave C{-12}, and the ensuing decline, wave X{-12}, will connect that first pattern with a second corrective pattern. And a third pattern could be added on in a like manner. When wave 4{-11} is complete, then wave 5{-11} will begin, as described above.
We Are Here.
These are the waves currently in progress under my principal analysis. Each line on the list shows the wave number, with the subscript in curly brackets, the traditional degree name, the starting date, the starting price of the S&P 500 E-mini futures, and the direction of the wave.
- S&P 500 Index:
- 5{+3} Supercycle, 7/8/1932, 4.40 (up)
- 5{+2} Cycle, 12/9/1974, 60.96 (up)
- 5{+1} Primary, 3/6/2009, 666.79 (up)
- 5{0} Intermediate, 12/26/2018, 2346.58 (up)
- 4{-1} Minor, 1/4/2022 4818.62 (down)
- 1{-2} Minute, 1/4/2022 4818.62 (down)
- S&P 500 Futures and index:
- 1{-3} Minuette, 1/4/2022, 4808.25 (down) (futures), 4818.62 (down) (index)
- S&P 500 Futures:
- 1{-4} Subminuette, 1/4/2022, 4808.25 (down)
- 1{-5} Micro, 1/4/2022, 4808.25 (down)
- 1{-6} Submicro, 1/4/2022, 4808.25 (down)
- 5{-7} Minuscule, 3/29/2022, 4631 (down)
- 5{-8} Subminuscule, 4/21/2022, 4509, (down)
Learning and other resources. Elliott wave analysis provides context, not prophecy. As the 20th century semanticist Alfred Korzybski put it in his book Science and Sanity (1933), “The map is not the territory … The only usefulness of a map depends on similarity of structure between the empirical world and the map.” And I would add, in the ever-changing markets, we can judge that similarity of structure only after the fact.
See the menu page Analytical Methods for a rundown on where to go for information on Elliott wave analysis.
By Tim Bovee, Portland, Oregon, July 1, 2022
Disclaimer
Tim Bovee, Private Trader tracks the analysis and trades of a private trader for his own accounts. Nothing in this blog constitutes a recommendation to buy or sell stocks, options or any other financial instrument. The only purpose of this blog is to provide education and entertainment.
No trader is ever 100 percent successful in his or her trades. Trading in the stock and option markets is risky and uncertain. Each trader must make trading decisions for his or her own account, and take responsibility for the consequences.
License
All content on Tim Bovee, Private Trader by Timothy K. Bovee is licensed under a Creative Commons Attribution-ShareAlike 4.0 International License.
Based on a work at www.timbovee.com.

Hey Tim, I do market analysis on S&P 500. My models were calling for bottom on June 30th for final bottom in SP500 (w stop below mid June lows) w forecast to peak in early Sept. happy trading
LikeLike