11 a.m. New York time
What’s happening now? The S&P 500 E-mini futures traded in a narrow range on Monday, as U.S. markets were closed to celebrate American independence from the British Empire. The price decline from the lower 3800s into the upper 3700s, covering fewer than 40 points altogether.
What does it mean? The June 30 low, 3741.25, marked the end of the initial leg of the downtrend that began two days earlier. The largely sideways movement that followed is an upward correction within the downtrend.
What are the alternatives? It’s possible that the decline that began on June 28 is part of a compound correction, linking a second corrective pattern to the first and extending the upward correction that began on June 14.
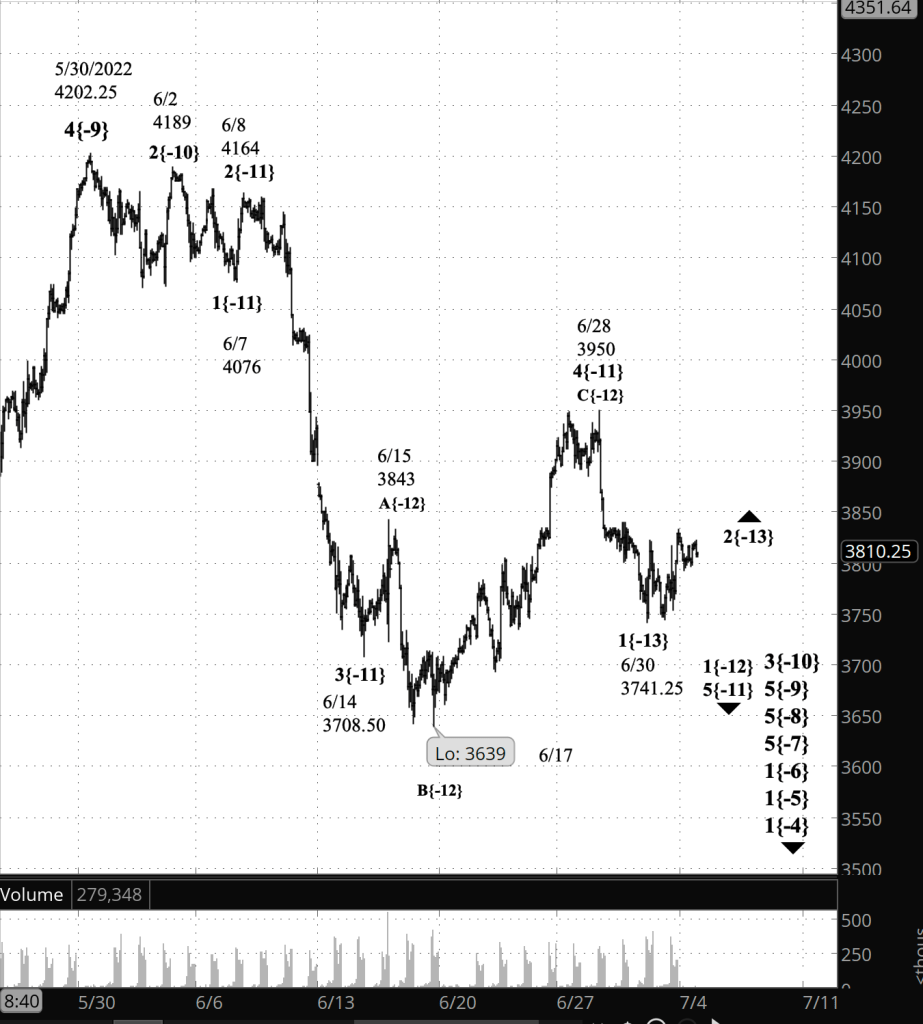
What does Elliott wave theory say? Under the principal analysis, wave 5{-11} began on June 28 from 3950 and internally completed wave 1{-13} on June 30 at 3741.25. Wave 1{-13} is the initial wave within wave 1{-12}, the first wave within the wave 5{-11} downtrend. Wave 2{-13}, an small upward correction, is now underway, and will be followed by a relatively more powerful decline, wave 3{-13}.
Under the alternative analysis, wave 4{-11}, which began on June 14 from 3708.50 is still underway and is forming a compound correction. The first corrective pattern ended with wave C{-12} on June 28 at 3950, the decline that followed is wave X{-12}, connecting the first corrective pattern with a second pattern to come.
We Are Here.
These are the waves currently in progress under my principal analysis. Each line on the list shows the wave number, with the subscript in curly brackets, the traditional degree name, the starting date, the starting price of the S&P 500 E-mini futures, and the direction of the wave.
- S&P 500 Index:
- 5{+3} Supercycle, 7/8/1932, 4.40 (up)
- 5{+2} Cycle, 12/9/1974, 60.96 (up)
- 5{+1} Primary, 3/6/2009, 666.79 (up)
- 5{0} Intermediate, 12/26/2018, 2346.58 (up)
- 4{-1} Minor, 1/4/2022 4818.62 (down)
- 1{-2} Minute, 1/4/2022 4818.62 (down)
- S&P 500 Futures and index:
- 1{-3} Minuette, 1/4/2022, 4808.25 (down) (futures), 4818.62 (down) (index)
- S&P 500 Futures:
- 1{-4} Subminuette, 1/4/2022, 4808.25 (down)
- 1{-5} Micro, 1/4/2022, 4808.25 (down)
- 1{-6} Submicro, 1/4/2022, 4808.25 (down)
- 5{-7} Minuscule, 3/29/2022, 4631 (down)
- 5{-8} Subminuscule, 4/21/2022, 4509, (down)
Learning and other resources. Elliott wave analysis provides context, not prophecy. As the 20th century semanticist Alfred Korzybski put it in his book Science and Sanity (1933), “The map is not the territory … The only usefulness of a map depends on similarity of structure between the empirical world and the map.” And I would add, in the ever-changing markets, we can judge that similarity of structure only after the fact.
See the menu page Analytical Methods for a rundown on where to go for information on Elliott wave analysis.
By Tim Bovee, Portland, Oregon, July 4, 2022
Disclaimer
Tim Bovee, Private Trader tracks the analysis and trades of a private trader for his own accounts. Nothing in this blog constitutes a recommendation to buy or sell stocks, options or any other financial instrument. The only purpose of this blog is to provide education and entertainment.
No trader is ever 100 percent successful in his or her trades. Trading in the stock and option markets is risky and uncertain. Each trader must make trading decisions for his or her own account, and take responsibility for the consequences.
License
All content on Tim Bovee, Private Trader by Timothy K. Bovee is licensed under a Creative Commons Attribution-ShareAlike 4.0 International License.
Based on a work at www.timbovee.com.

You must be logged in to post a comment.