3:30 p.m. New York time
Half an hour before the closing bell. The S&P 500 has traded in a narrow range, remaining below Friday’s high, 4016.25, and above that day’s low, 3941.50. No change in this morning’s analysis. I’ve updated the chart, below.
2:05 p.m. New York time
MCD, UPS earnings plays entered. I’ve entered two short bear put vertical spreads, using options that trade for the last time on August 19. I’ve posted trade analyses for MCD and UPS.
9:35 a.m. New York time
What’s happening now? The S&P 500 E-mini futures rose overnight from the mid-3900s back into the upper 3900s. The price remained below Friday’s high, 4016.25.
What does it mean? The nature of Friday’s high remains uncertain. For my primary analysis, I’ve chosen to treat it as a stopping point within the first leg of an upward correction that began on July 14. Under this scenario, the overnight rise is a step leading to a new high.
What is the alternative? Of equal likelihood, Friday’s high could mark the end of the first leg of the upward correction, and the subsequent decline and rise are the early stages of the correction’s middle leg.
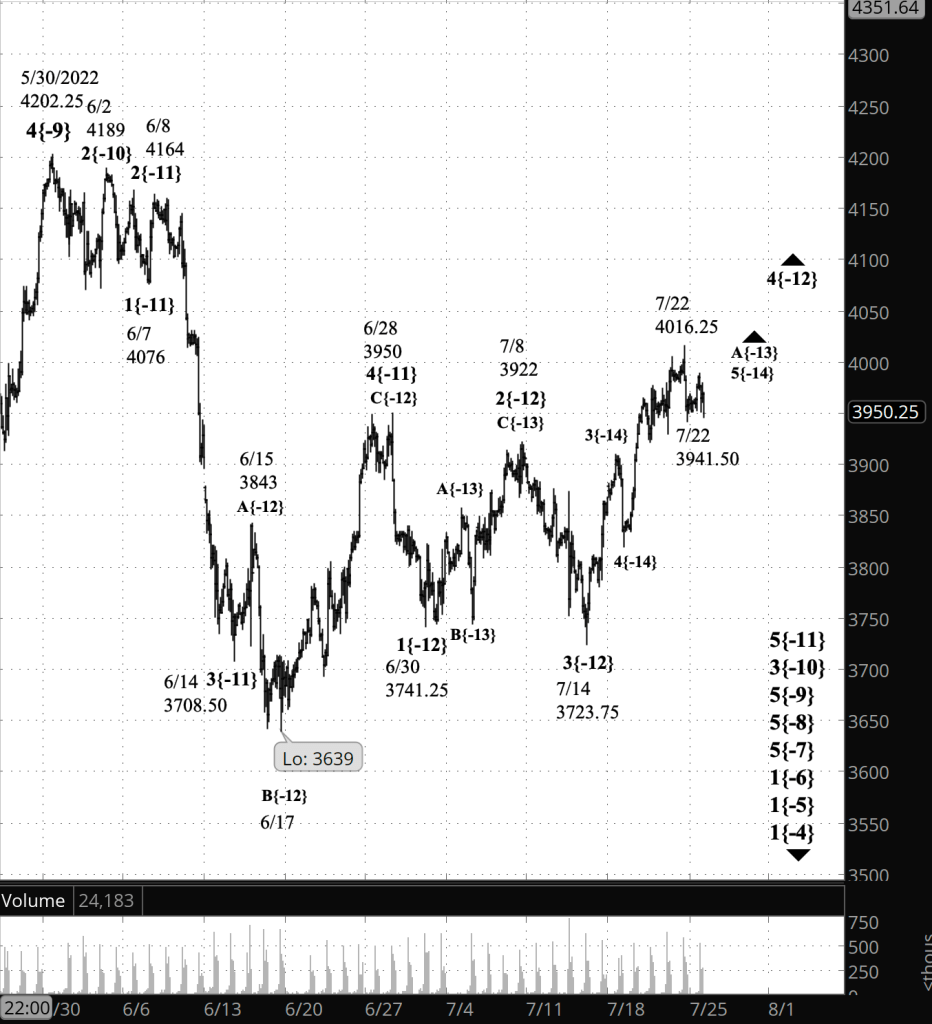
What does Elliott wave theory say? Under the principal analysis, wave A{-13} began on July 14 and is still underway. It is the first segment of an upward correction, wave 4{-12}.
Under the alternative analysis, wave A{-13} ended at Friday’s high, 4016.25, and from that point wave B{-13} began its decline.
In either case, the future rising wave C{-13} will likely be the final wave within the upward correction. The end of the correction, wave 4{-12}, will also be the beginning of wave 5{-12}, a resumption of the downtrend, wave 5{-11}, that began on June 28 from 3950. Wave 5{-12} will eventually carry the price back down to the 3700s or 3600s, and perhaps even lower.
It’s possible that wave 4{-12} will form a compound structure containing two or three corrective patterns. Most 4th wave corrections form simple structures, with with a single corrective pattern.
Wave 5{-11} is the final wave of a larger downtrend, wave 3{-10}, which in turn is part of a series of waves a increasingly greater magnitude, listed below in the “We Are Here” section.
We Are Here.
These are the waves currently in progress under my principal analysis. Each line on the list shows the wave number, with the subscript in curly brackets, the traditional degree name, the starting date, the starting price of the S&P 500 E-mini futures, and the direction of the wave.
- S&P 500 Index:
- 5{+3} Supercycle, 7/8/1932, 4.40 (up)
- 5{+2} Cycle, 12/9/1974, 60.96 (up)
- 5{+1} Primary, 3/6/2009, 666.79 (up)
- 5{0} Intermediate, 12/26/2018, 2346.58 (up)
- 4{-1} Minor, 1/4/2022 4818.62 (down)
- 1{-2} Minute, 1/4/2022 4818.62 (down)
- S&P 500 Futures and index:
- 1{-3} Minuette, 1/4/2022, 4808.25 (down) (futures), 4818.62 (down) (index)
- S&P 500 Futures:
- 1{-4} Subminuette, 1/4/2022, 4808.25 (down)
- 1{-5} Micro, 1/4/2022, 4808.25 (down)
- 1{-6} Submicro, 1/4/2022, 4808.25 (down)
- 5{-7} Minuscule, 3/29/2022, 4631 (down)
- 5{-8} Subminuscule, 4/21/2022, 4509 (down)
- 5{-9} Bitsy, 5/30/2022, 4202.25 (down)
- 3{-10} Subbitsy, 6/2/2022, 4189 (down)
- 5{-11} Deci, 6/8/2022, 4164 (down)
Learning and other resources. Elliott wave analysis provides context, not prophecy. As the 20th century semanticist Alfred Korzybski put it in his book Science and Sanity (1933), “The map is not the territory … The only usefulness of a map depends on similarity of structure between the empirical world and the map.” And I would add, in the ever-changing markets, we can judge that similarity of structure only after the fact.
See the menu page Analytical Methods for a rundown on where to go for information on Elliott wave analysis.
By Tim Bovee, Portland, Oregon, July 25, 2022
Disclaimer
Tim Bovee, Private Trader tracks the analysis and trades of a private trader for his own accounts. Nothing in this blog constitutes a recommendation to buy or sell stocks, options or any other financial instrument. The only purpose of this blog is to provide education and entertainment.
No trader is ever 100 percent successful in his or her trades. Trading in the stock and option markets is risky and uncertain. Each trader must make trading decisions for his or her own account, and take responsibility for the consequences.
License
All content on Tim Bovee, Private Trader by Timothy K. Bovee is licensed under a Creative Commons Attribution-ShareAlike 4.0 International License.
Based on a work at www.timbovee.com.

You must be logged in to post a comment.