3:30 p.m. New York time
Half an hour before the closing bell. The S&P 500 moved slightly higher during the session, to 4147.25 on the futures, but has generally remained below that level.in the 4130s and 4120s. The higher high adds backing to this morning’s principal analysis: The upward correction that began on July 14 is still underway. In Elliott wave terminology: Wave 4{-12} is still underway, and internally it is nearing the end of the final wave, C{-13} of a corrective pattern.
I’ve updated the chart.
10:35 a.m. New York time
MOS earnings play entry. I’ve entered a short bull put vertical spread position on MOS, using options that trade for the last time on September 17, and have posted an analysis of the trade.
9:35 a.m. New York time
What’s happening now? The S&P 500 E-mini futures remained below Friday’s high, 4144, when trading resumed overnight, fluctuating within and below the 4110s.
What does it mean? Under my principal analysis, the upward correction that began on July 14 is still underway and has an additional push to the upside left before reaching completion.
What are the alternatives? The upward correction ended on Friday at 4144 and the subsequent decline is the first tentative step in the resumption of the downtrend that began on June 28 from 4164.
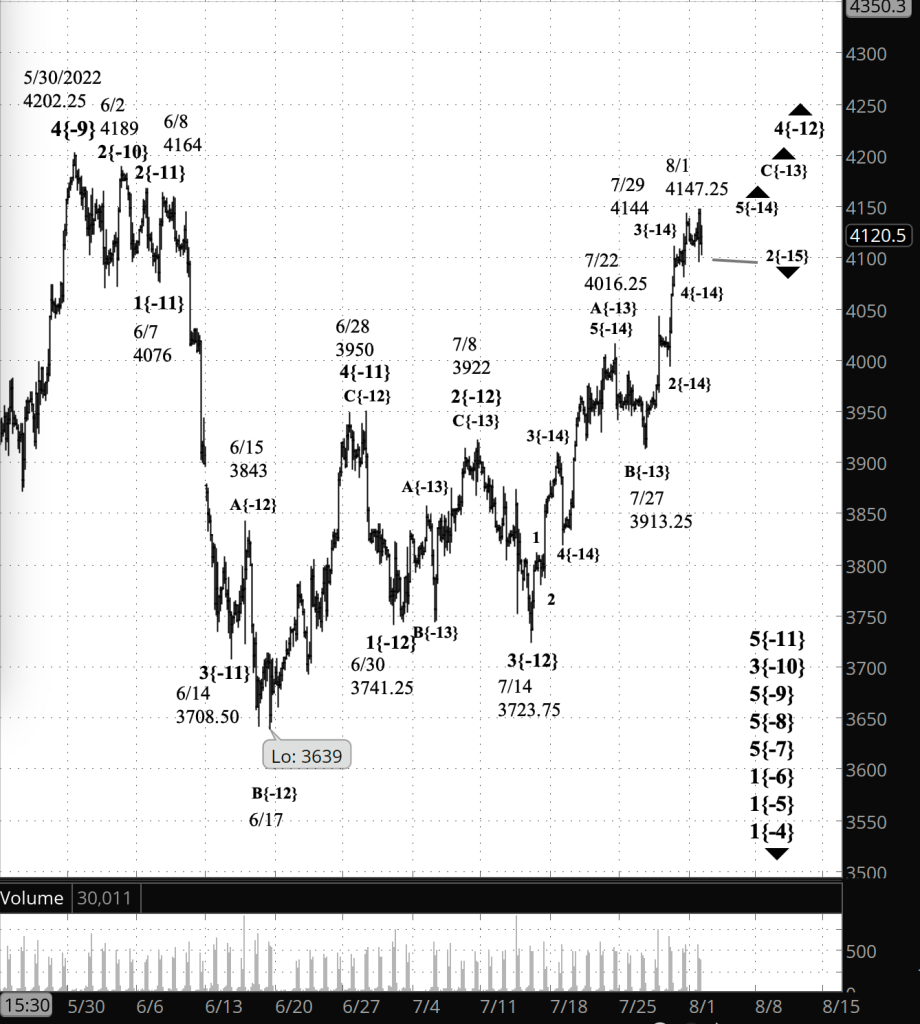
What does Elliott wave theory say? Under the principal analysis, wave 4{-12}, an upward correction that began on July 14 from 3723.75, is still underway. Friday’s high marked a stopping point within wave 5{-14}, the final wave within the correction’s third internal segment, wave C{-13}. After a small downward correction, wave 2{-15}, wave 5{-14} will carry wave C{-13} to new heights and completion.
Wave C{-13} will be the end of wave 4{-12}, unless the correction takes a compound structure, linking together two or three corrective patterns. If wave 4{-12} forms a simple structure — one corrective pattern — then wave 5{-12} will follow the end of wave C{-13} and its parent, wave 4{-12}, carrying the price down into the 3700s or 3600s, and perhaps even lower. If wave 4{-12} forms a compound structure, then wave C{-13} will be followed by a connecting wave, X{-13}, and then another corrective pattern as wave 4{-12} continues.
Under the alternative analysis, Friday’s high marked the end of wave 5{-14} within wave C{-13}, and therefore the end of the upward correction, wave 4{-12}. Under this scenario, wave 5{-12} has begun its downward journey. At the smallest level, the alternative counts Friday’s high as the end of wave 5{-15} within wave 5{-14}.
All of this is happening within downtrending wave 5{-11}, which began on June 28 from 4164, within a nested series of increasingly larger downtrending waves stretching up to wave 4{-1}, which began on January 4 from 4818.62. Its parent, uptrending wave 5{0}, began on December 26, 2018 from 2346.58. See the “We Are Here” section for a full list of presently ongoing waves.
We Are Here.
These are the waves currently in progress under my principal analysis. Each line on the list shows the wave number, with the subscript in curly brackets, the traditional degree name, the starting date, the starting price of the S&P 500 E-mini futures, and the direction of the wave.
- S&P 500 Index:
- 5{+3} Supercycle, 7/8/1932, 4.40 (up)
- 5{+2} Cycle, 12/9/1974, 60.96 (up)
- 5{+1} Primary, 3/6/2009, 666.79 (up)
- 5{0} Intermediate, 12/26/2018, 2346.58 (up)
- 4{-1} Minor, 1/4/2022 4818.62 (down)
- 1{-2} Minute, 1/4/2022 4818.62 (down)
- S&P 500 Futures and index:
- 1{-3} Minuette, 1/4/2022, 4808.25 (down) (futures), 4818.62 (down) (index)
- S&P 500 Futures:
- 1{-4} Subminuette, 1/4/2022, 4808.25 (down)
- 1{-5} Micro, 1/4/2022, 4808.25 (down)
- 1{-6} Submicro, 1/4/2022, 4808.25 (down)
- 5{-7} Minuscule, 3/29/2022, 4631 (down)
- 5{-8} Subminuscule, 4/21/2022, 4509 (down)
- 5{-9} Bitsy, 5/30/2022, 4202.25 (down)
- 3{-10} Subbitsy, 6/2/2022, 4189 (down)
- 5{-11} Deci, 6/8/2022, 4164 (down)
Learning and other resources. Elliott wave analysis provides context, not prophecy. As the 20th century semanticist Alfred Korzybski put it in his book Science and Sanity (1933), “The map is not the territory … The only usefulness of a map depends on similarity of structure between the empirical world and the map.” And I would add, in the ever-changing markets, we can judge that similarity of structure only after the fact.
See the menu page Analytical Methods for a rundown on where to go for information on Elliott wave analysis.
By Tim Bovee, Portland, Oregon, August 1, 2022
Disclaimer
Tim Bovee, Private Trader tracks the analysis and trades of a private trader for his own accounts. Nothing in this blog constitutes a recommendation to buy or sell stocks, options or any other financial instrument. The only purpose of this blog is to provide education and entertainment.
No trader is ever 100 percent successful in his or her trades. Trading in the stock and option markets is risky and uncertain. Each trader must make trading decisions for his or her own account, and take responsibility for the consequences.
License
All content on Tim Bovee, Private Trader by Timothy K. Bovee is licensed under a Creative Commons Attribution-ShareAlike 4.0 International License.
Based on a work at www.timbovee.com.

You must be logged in to post a comment.