4 p.m. New York time
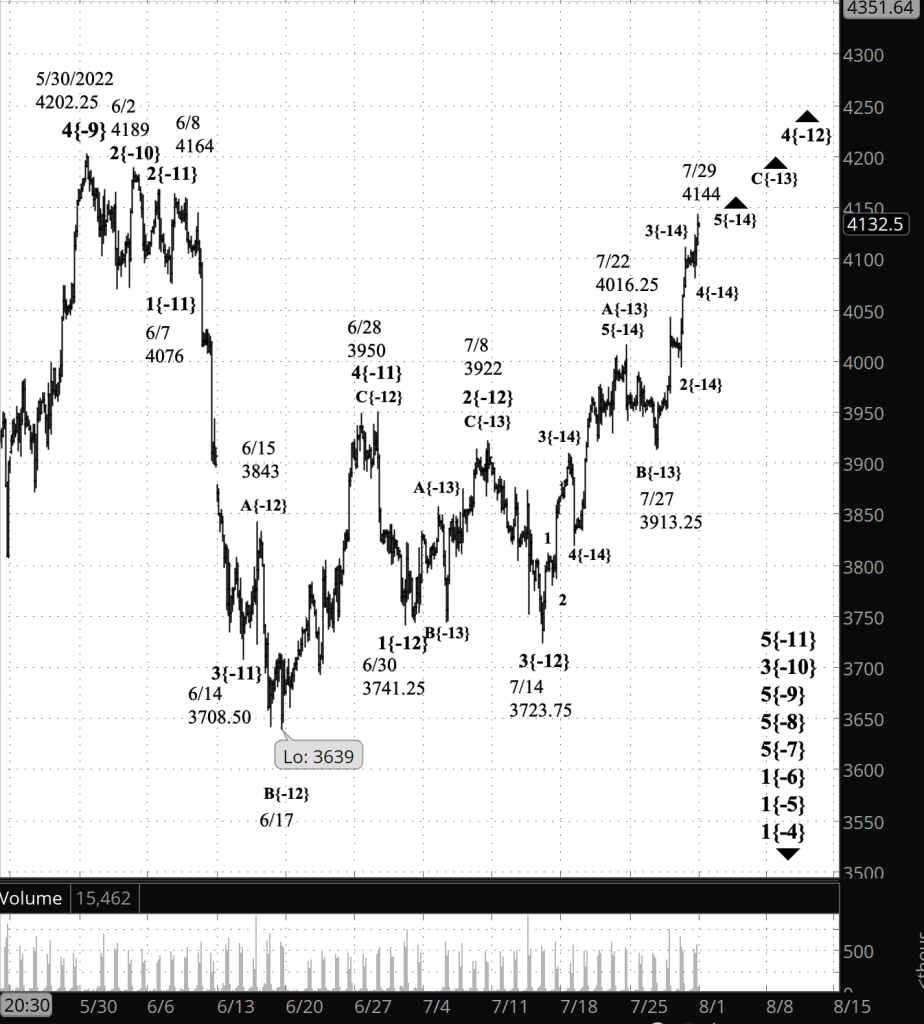
End of the session. The S&P 500 futures ended the session at 4144, a level last seen on June 9, which saw a high 25 cents above today’s peak. I’ve updated the chart.
3:30 p.m. New York time
Half an hour before the closing bell. The S&P 500 has continued to rise during the trading session, reaching into the 4140s on the futures.
Under my principal analysis, yesterday’s high was the end of the middle wave within the rising last leg of a larger rising corrective pattern that began on July 14. The pull back was the small correction within the last leg, and the consequent rise is the final segment.
In Elliott wave terminology: Within wave C{-13}, yesterday’s high ended wave 3{-14}, the downward retracement was wave 4{-14}, and the subsequent rise in today’s session is wave 5{-14}, the final wave within the C wave. This is all happening with wave 4{-12}, the upward correction that began on July 14.
Bottom line: At this point we’re fishing for a top. Any fresh high can be seen as the end of wave 5{-14} and its parent and grandparent waves, C{-13} and most likely 4{-12}
No change in the analysis. I’ve updated the chart.
1:50 p.m. New York time
AAPL earnings play exit. I’ve exited my short bull put vertical spread on AAPL for 53.5% of maximum potential profit and have updated the trade analysis with full results.
9:35 a.m. New York time
What’s happening now? The S&P 500 E-mini futures continued to rise after yesterday’s closing bell, reaching a high of 4111 and then pulling back slightly.
What does it mean? By my count, the overnight high marks the end of the middle segment within the final leg of a corrective pattern that began on July 14. The middle segment will be followed by a pullback and then a push higher.
What is the alternative? It’s possible that the small pullback isn’t the end of the middle segment and that it will push higher before it’s done.
What does Elliott wave theory say? Under the principal analysis, the overnight high marks the end of rising wave 3{-14}, the middle of five waves within rising wave C{-13}, which in turn is the final wave of a three-wave corrective pattern and perhaps of the entire upward correction, wave 4{-12}, which began on July 14. Wave 3{-14} is followed by a wave 4{-14} pull back, which in turn will be followed by rising wave 5{-14}, which will bring waves C{-13} and its parent, wave 4{-12}, to completion.
Some 4th waves form compound corrections, connecting two or three corrective patterns. Most have only a single corrective pattern.
The alternative analysis recognizes that the pull back from yesterday’s high may not be wave 4{-14} but instead could be a movement of smaller degree. If that turns out to be the case, then wave 3{-14} has more upside ahead of it before it reaches completion.
In either vase, wave 4{-12} will be followed by wave 5{-12}, the final component of a downtrend, wave 5{-11}, that began on June 28.
We Are Here.
These are the waves currently in progress under my principal analysis. Each line on the list shows the wave number, with the subscript in curly brackets, the traditional degree name, the starting date, the starting price of the S&P 500 E-mini futures, and the direction of the wave.
- S&P 500 Index:
- 5{+3} Supercycle, 7/8/1932, 4.40 (up)
- 5{+2} Cycle, 12/9/1974, 60.96 (up)
- 5{+1} Primary, 3/6/2009, 666.79 (up)
- 5{0} Intermediate, 12/26/2018, 2346.58 (up)
- 4{-1} Minor, 1/4/2022 4818.62 (down)
- 1{-2} Minute, 1/4/2022 4818.62 (down)
- S&P 500 Futures and index:
- 1{-3} Minuette, 1/4/2022, 4808.25 (down) (futures), 4818.62 (down) (index)
- S&P 500 Futures:
- 1{-4} Subminuette, 1/4/2022, 4808.25 (down)
- 1{-5} Micro, 1/4/2022, 4808.25 (down)
- 1{-6} Submicro, 1/4/2022, 4808.25 (down)
- 5{-7} Minuscule, 3/29/2022, 4631 (down)
- 5{-8} Subminuscule, 4/21/2022, 4509 (down)
- 5{-9} Bitsy, 5/30/2022, 4202.25 (down)
- 3{-10} Subbitsy, 6/2/2022, 4189 (down)
- 5{-11} Deci, 6/8/2022, 4164 (down)
Learning and other resources. Elliott wave analysis provides context, not prophecy. As the 20th century semanticist Alfred Korzybski put it in his book Science and Sanity (1933), “The map is not the territory … The only usefulness of a map depends on similarity of structure between the empirical world and the map.” And I would add, in the ever-changing markets, we can judge that similarity of structure only after the fact.
See the menu page Analytical Methods for a rundown on where to go for information on Elliott wave analysis.
By Tim Bovee, Portland, Oregon, July 29, 2022
Disclaimer
Tim Bovee, Private Trader tracks the analysis and trades of a private trader for his own accounts. Nothing in this blog constitutes a recommendation to buy or sell stocks, options or any other financial instrument. The only purpose of this blog is to provide education and entertainment.
No trader is ever 100 percent successful in his or her trades. Trading in the stock and option markets is risky and uncertain. Each trader must make trading decisions for his or her own account, and take responsibility for the consequences.
License
All content on Tim Bovee, Private Trader by Timothy K. Bovee is licensed under a Creative Commons Attribution-ShareAlike 4.0 International License.
Based on a work at www.timbovee.com.

You must be logged in to post a comment.