3:30 p.m. New York time
Half an hour before the closing bell. The S&P 500 rose higher during the session, to 4212 on the futures. No change in the analysis. Chart updated.
9:35 a.m. New York time
What’s happening now? The S&P 500 E-mini futures rose sharply as the opening bell approached, reaching 4201.50 before pulling back slightly.
What does it mean? The rise began when the consumer price index came in slightly lower than analysts had expected. The rise moved above the August 8 high, 4188, confirming that the uptrend that began on July 14 is still underway.
What are the alternatives? As always when the market is reaching for a peak, any new high can potentially be the end of the uptrend. Or not. The only way to know for sure is when the price reverses sharply enough to show that a significant decline has begun.
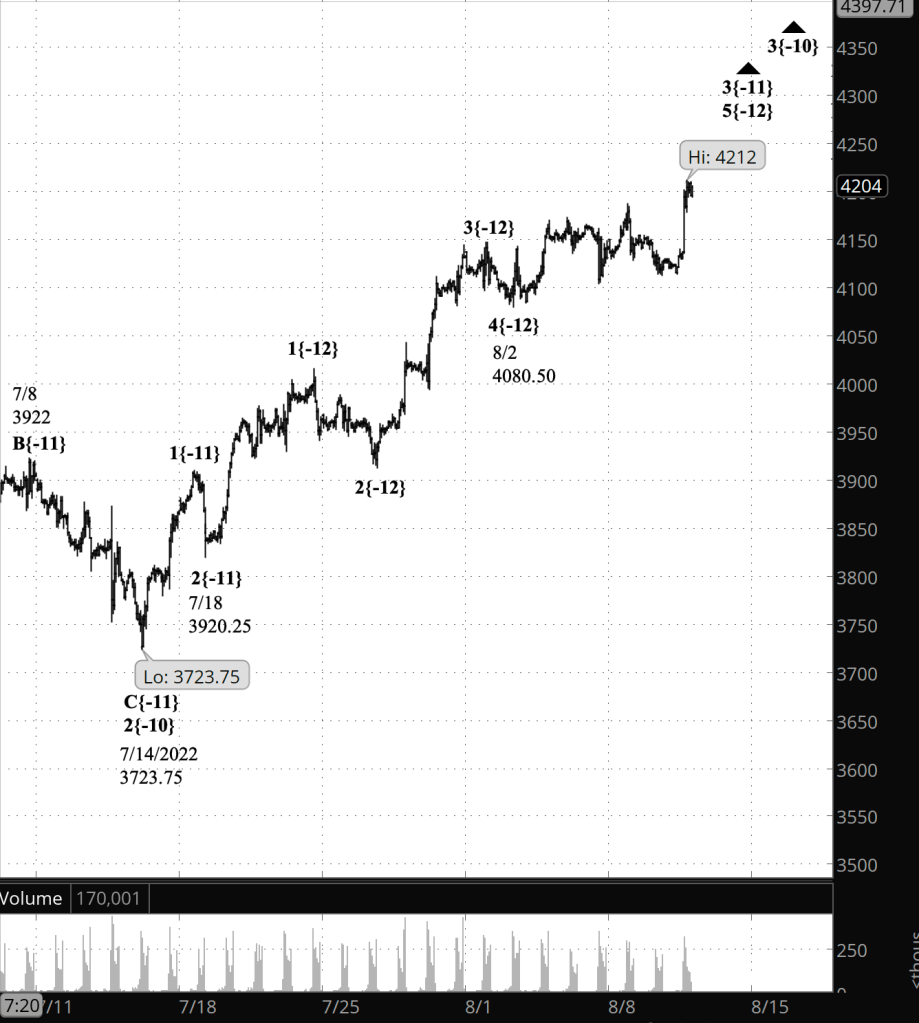
What does Elliott wave theory say? Uptrending wave 3{-10}, which began on July 14 from 3723.75, continues its rise, reaching a high before the opening bell that was 477.75 points above the wave’s starting point.
Internally, I count wave 3{-10} as being in the final wave, 5{-12}, within it’s middle wave, 3{-11}. There is sufficient ambiguity in the internal count to allow it be analyzed as being within wave 5{-11}, the final wave within wave 3{-10}. That alternative would be confirmed by a significant price reversal to the downside. The count I show on the chart would be confirmed by a decline from the peak in a three-wave correction, wave 4{-10}, and then a five-wave push up, wave 5{-10}.
Learning and other resources. Elliott wave analysis provides context, not prophecy. As the 20th century semanticist Alfred Korzybski put it in his book Science and Sanity (1933), “The map is not the territory … The only usefulness of a map depends on similarity of structure between the empirical world and the map.” And I would add, in the ever-changing markets, we can judge that similarity of structure only after the fact.
See the menu page Analytical Methods for a rundown on where to go for information on Elliott wave analysis.
By Tim Bovee, Portland, Oregon, August 10, 2022
Disclaimer
Tim Bovee, Private Trader tracks the analysis and trades of a private trader for his own accounts. Nothing in this blog constitutes a recommendation to buy or sell stocks, options or any other financial instrument. The only purpose of this blog is to provide education and entertainment.
No trader is ever 100 percent successful in his or her trades. Trading in the stock and option markets is risky and uncertain. Each trader must make trading decisions for his or her own account, and take responsibility for the consequences.
License
All content on Tim Bovee, Private Trader by Timothy K. Bovee is licensed under a Creative Commons Attribution-ShareAlike 4.0 International License.
Based on a work at www.timbovee.com.

You must be logged in to post a comment.